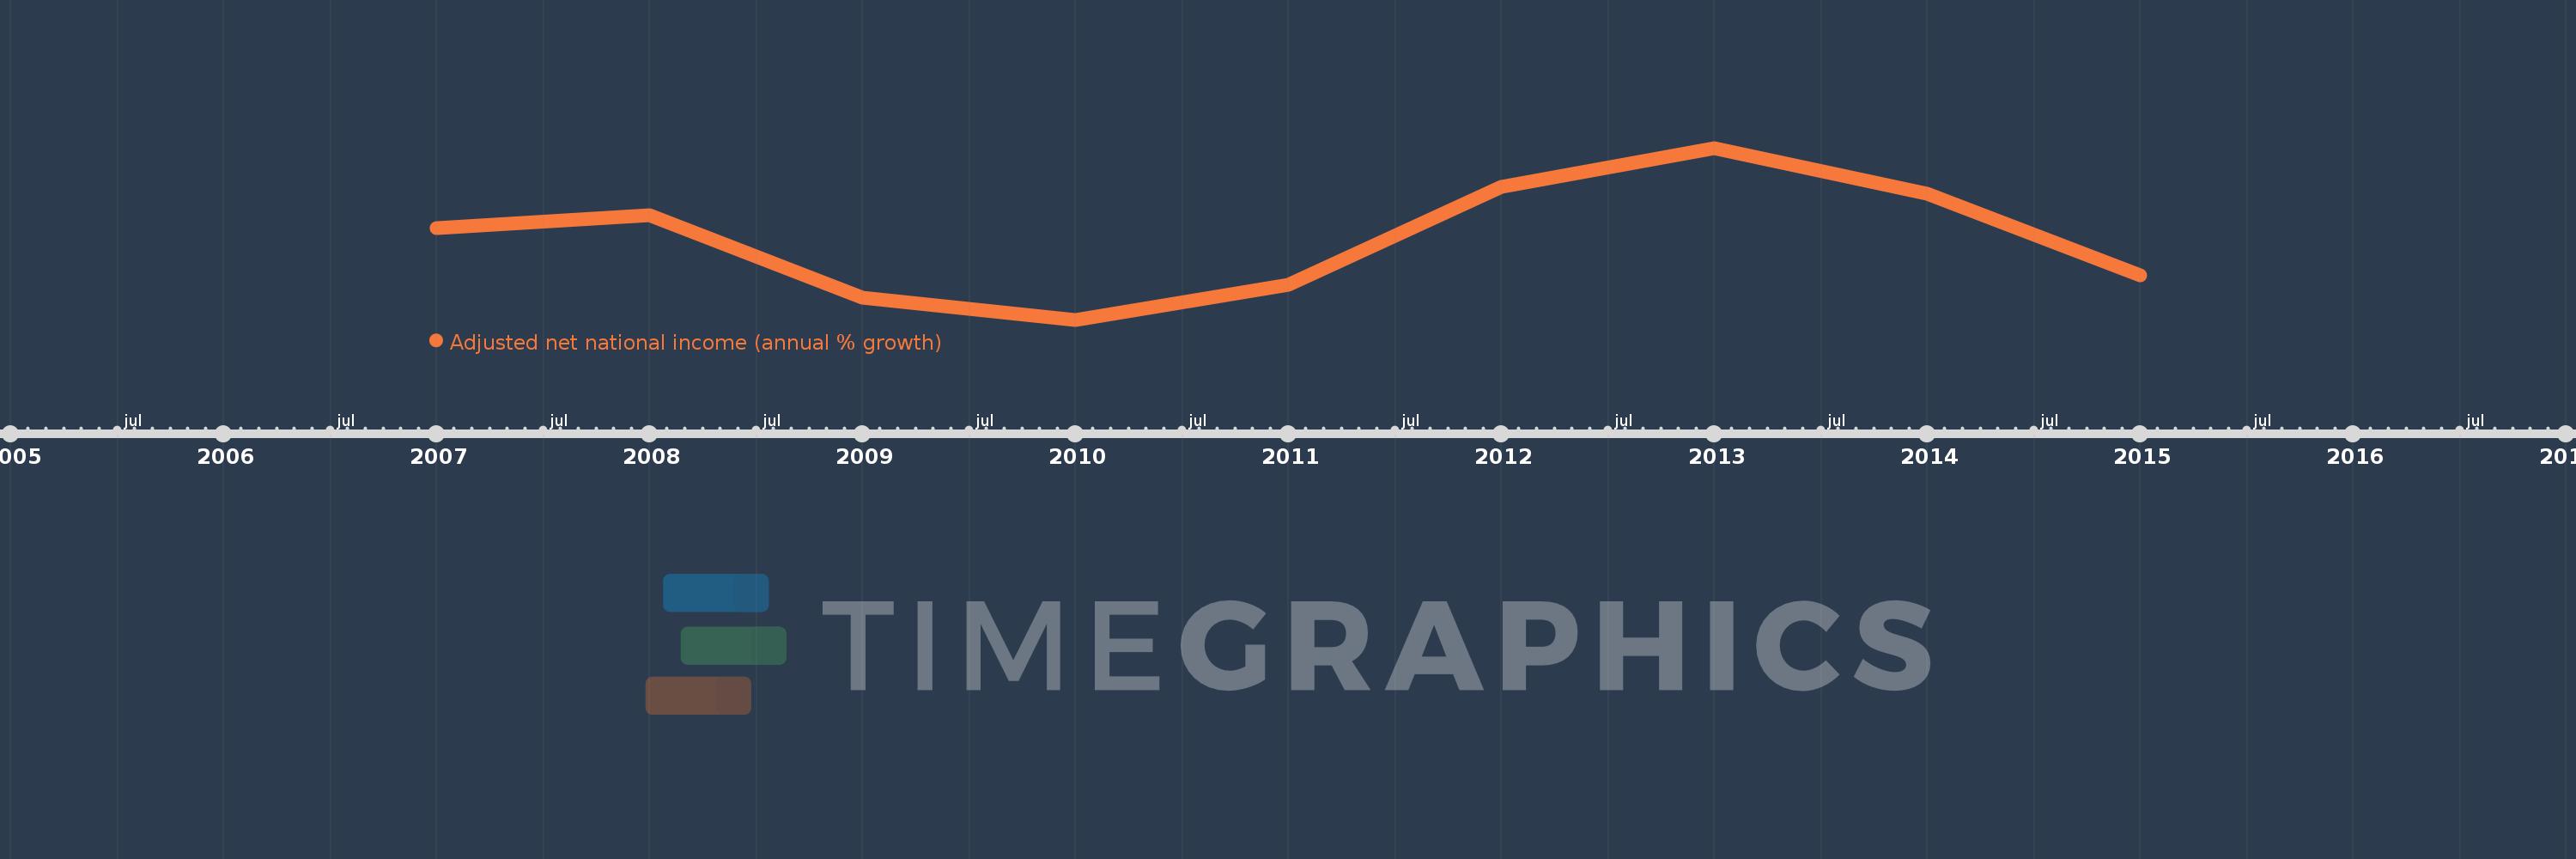
This timeline shows a graph from 2007 to 2015 of Mongolia. No data until 2006. Number of actual observations by date: 9.
Source name:
World Development Indicators
Source organization:
World Bank staff estimates based on sources and methods in World Bank's "The Changing Wealth of Nations: Measuring Sustainable Development in the New Millennium" (2011).
Categories, topics:
Economy & Growth
Last updated:
apr 23, 2017
Indicators value changes by year
Meaning:
9.32
Minimum:
-4.361
jan 1, 2010
Maximum:
24.674
jan 1, 2013
At the date of observation
Value
Absolute change
Change from the previous value
jan 1, 2007
11.185
+11.185
0.0%
jan 1, 2008
13.264
+2.079
18.59%
jan 1, 2009
-0.576
-13.84
-104.34%
jan 1, 2010
-4.361
-3.785
656.81%
jan 1, 2011
1.524
+5.885
-134.96%
jan 1, 2012
18.11
+16.585
1.09K%
jan 1, 2013
24.674
+6.564
36.25%
jan 1, 2014
16.971
-7.703
-31.22%
jan 1, 2015
3.092
-13.879
-81.78%
Ranking of countries by current statistics by years