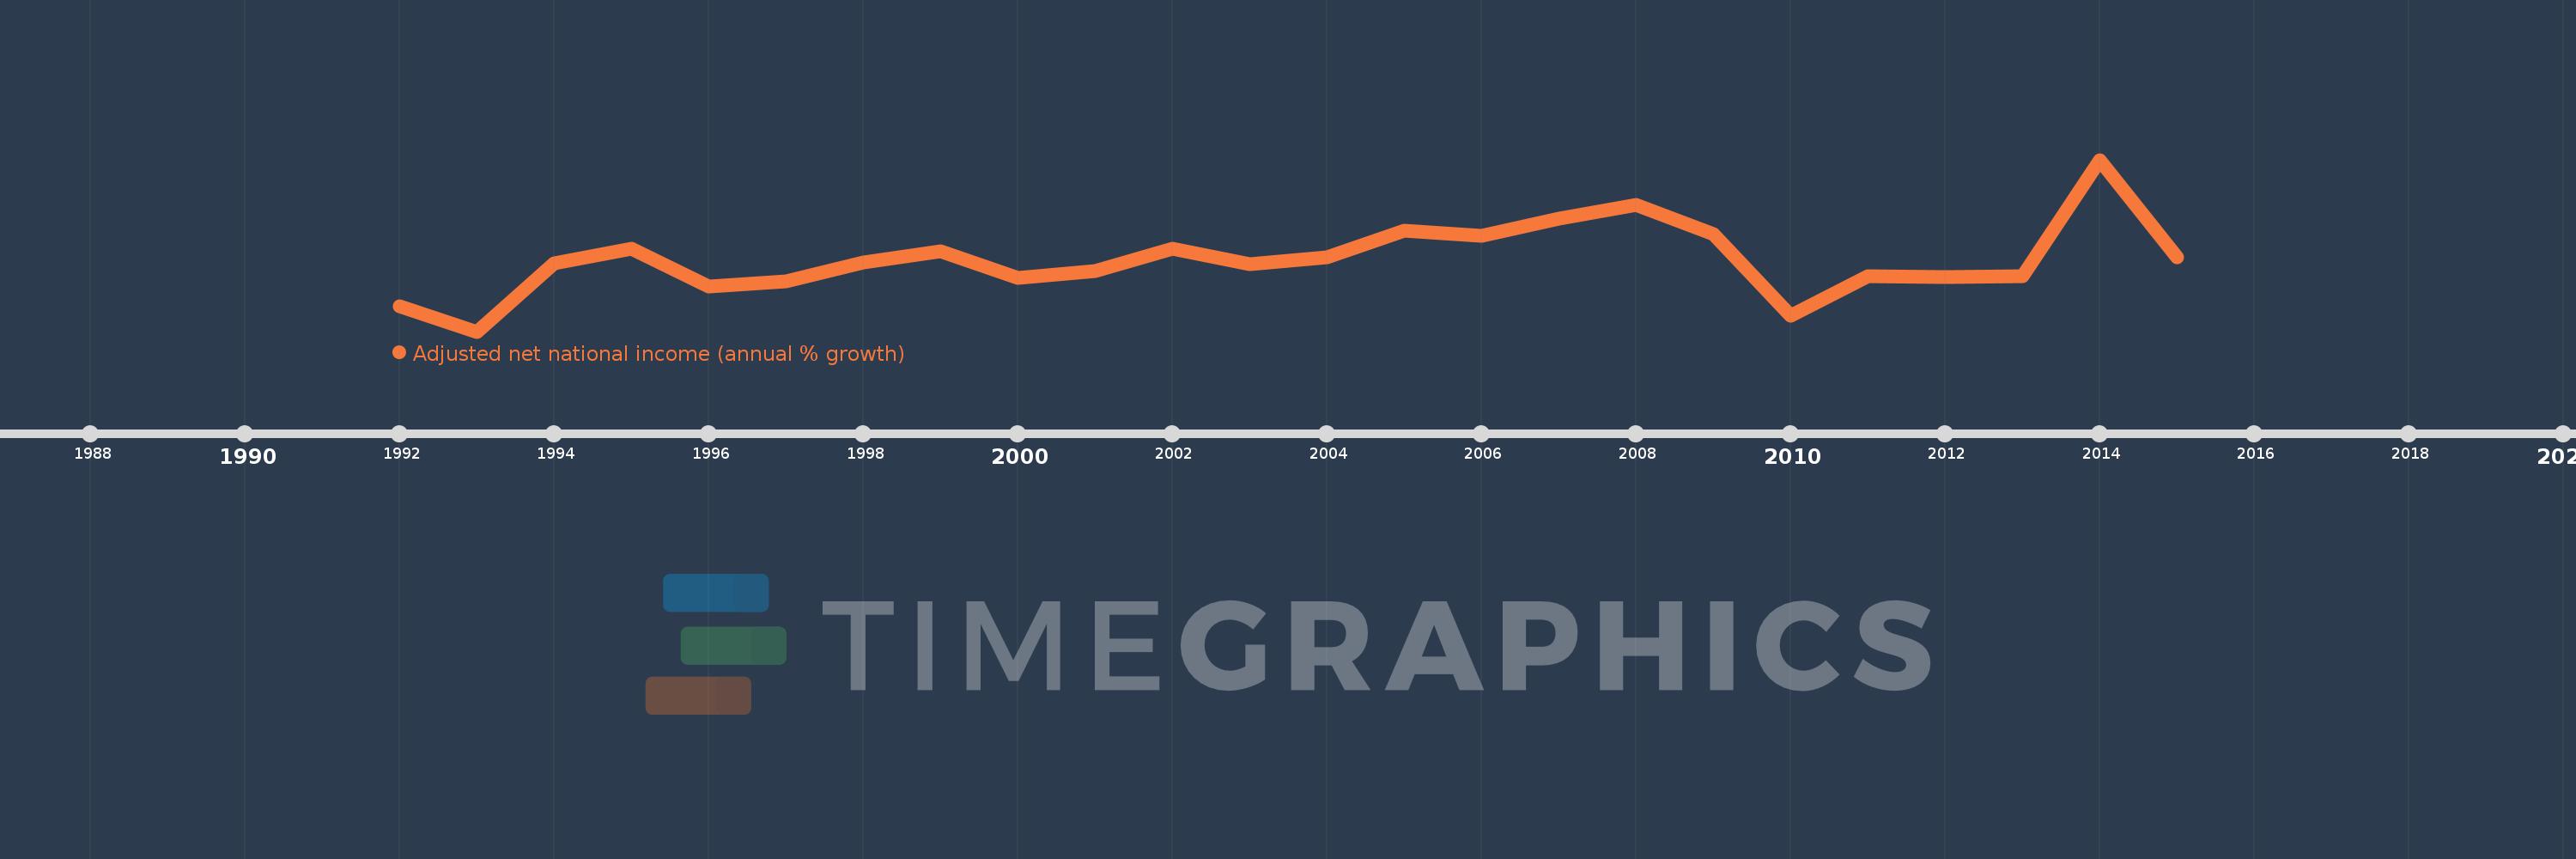
This timeline shows a graph from 1992 to 2015 of Romania. No data until 1991. Number of actual observations by date: 24.
Source name:
World Development Indicators
Source organization:
World Bank staff estimates based on sources and methods in World Bank's "The Changing Wealth of Nations: Measuring Sustainable Development in the New Millennium" (2011).
Categories, topics:
Economy & Growth
Last updated:
apr 23, 2017
Indicators value changes by year
Meaning:
4.137
Minimum:
-11.652
jan 1, 1993
Maximum:
26.138
jan 1, 2014
At the date of observation
Value
Absolute change
Change from the previous value
jan 1, 1992
-6.13
-6.13
0.0%
jan 1, 1993
-11.652
-5.522
90.08%
jan 1, 1994
3.411
+15.063
-129.28%
jan 1, 1995
6.63
+3.219
94.36%
jan 1, 1996
-1.659
-8.289
-125.02%
jan 1, 1997
-0.656
+1.003
-60.47%
jan 1, 1998
3.616
+4.272
-651.55%
jan 1, 1999
5.931
+2.315
64.01%
jan 1, 2000
0.221
-5.71
-96.27%
jan 1, 2001
1.752
+1.531
692.45%
jan 1, 2002
6.533
+4.781
272.82%
jan 1, 2003
3.165
-3.368
-51.55%
jan 1, 2004
4.747
+1.582
49.98%
jan 1, 2005
10.575
+5.828
122.78%
jan 1, 2006
9.493
-1.083
-10.24%
jan 1, 2007
13.213
+3.72
39.19%
jan 1, 2008
16.283
+3.07
23.24%
jan 1, 2009
9.704
-6.579
-40.4%
jan 1, 2010
-8.183
-17.887
-184.33%
jan 1, 2011
0.444
+8.627
-105.42%
jan 1, 2012
0.4
-0.044
-9.81%
jan 1, 2013
0.601
+0.201
50.11%
jan 1, 2014
26.138
+25.537
4.25K%
jan 1, 2015
4.698
-21.44
-82.02%
Ranking of countries by current statistics by years