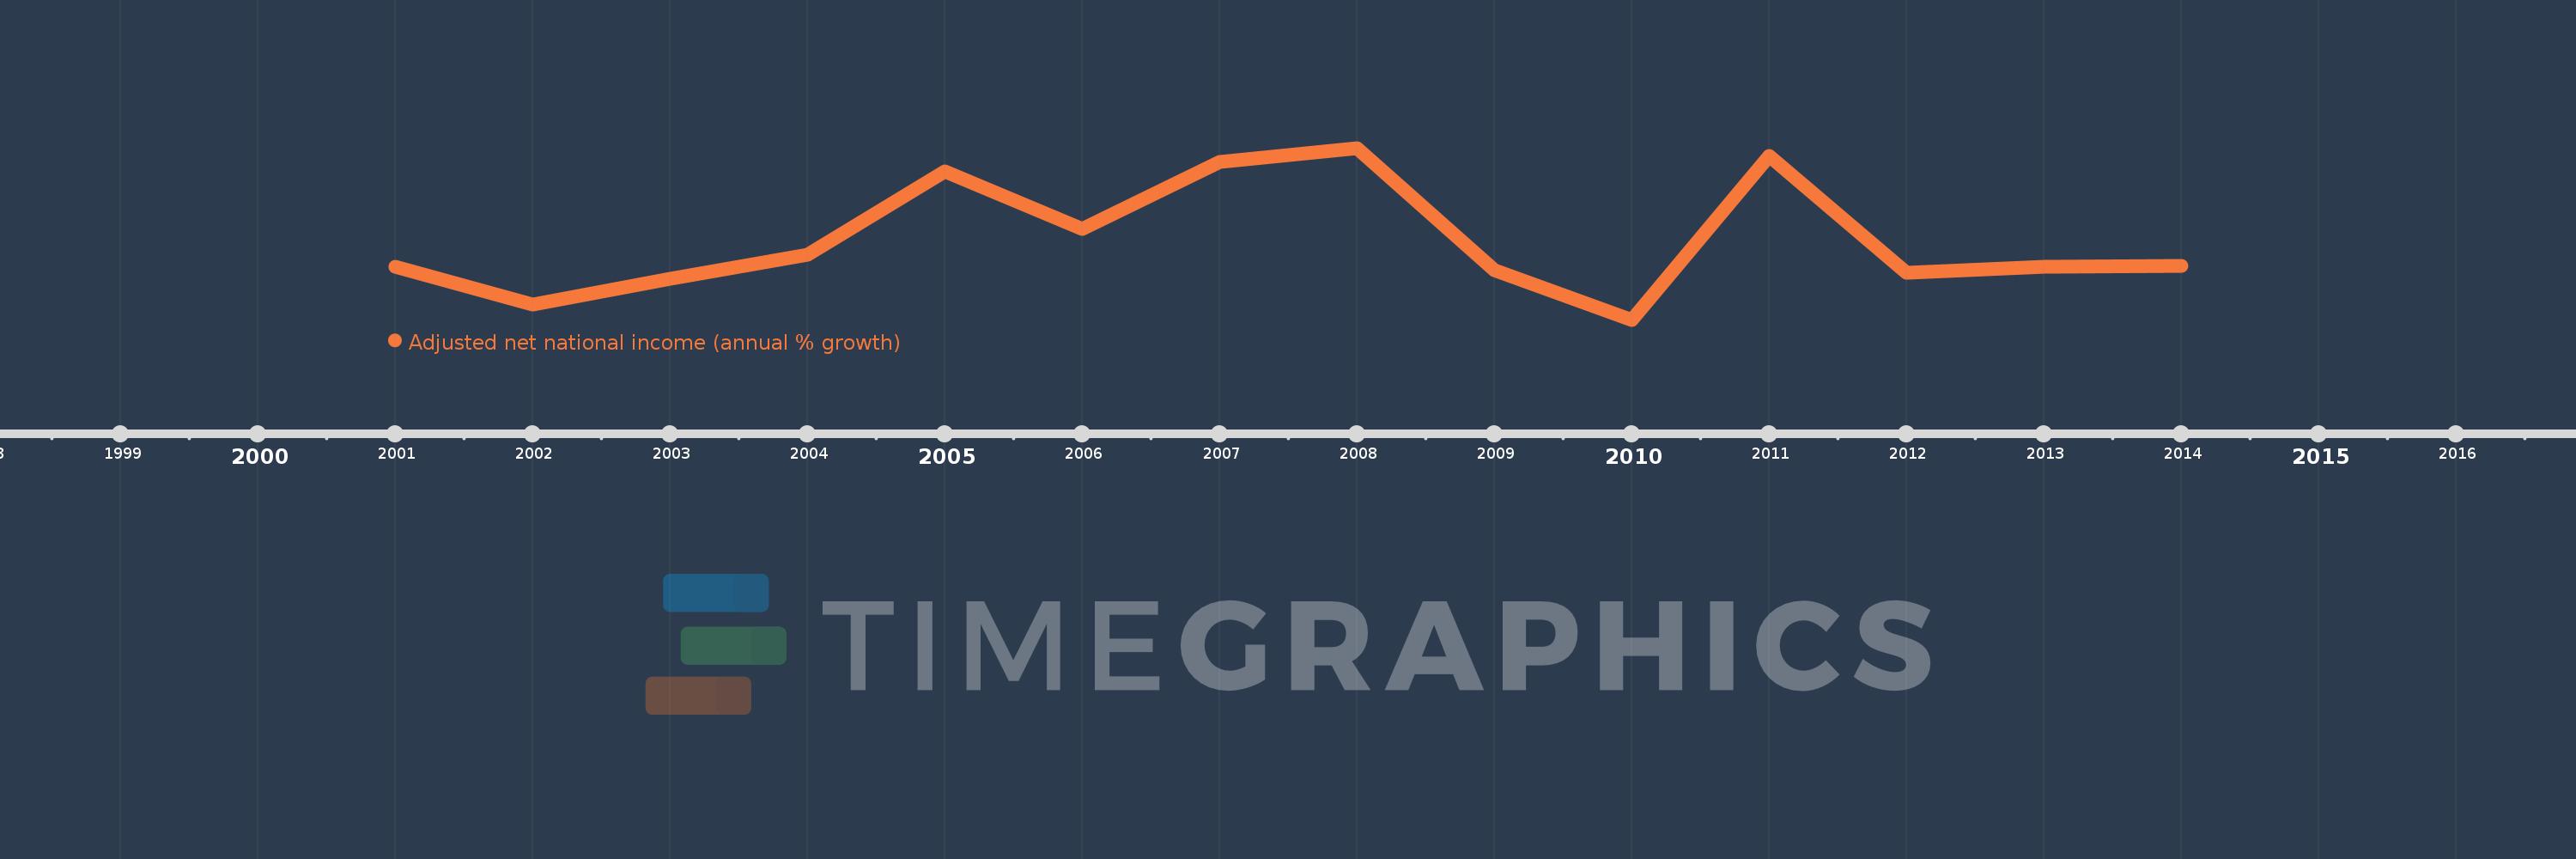
This timeline shows a graph from 2001 to 2014 of IDA & IBRD total. No data until 2000. Number of actual observations by date: 14.
Source name:
World Development Indicators
Source organization:
World Bank staff estimates based on sources and methods in World Bank's "The Changing Wealth of Nations: Measuring Sustainable Development in the New Millennium" (2011).
Categories, topics:
Economy & Growth
Last updated:
apr 23, 2017
Indicators value changes by year
Meaning:
4.692
Minimum:
1.256
jan 1, 2010
Maximum:
8.702
jan 1, 2008
At the date of observation
Value
Absolute change
Change from the previous value
jan 1, 2001
3.551
+3.551
0.0%
jan 1, 2002
1.904
-1.646
-46.37%
jan 1, 2003
3.03
+1.126
59.11%
jan 1, 2004
4.075
+1.045
34.51%
jan 1, 2005
7.688
+3.613
88.67%
jan 1, 2006
5.205
-2.483
-32.3%
jan 1, 2007
8.091
+2.886
55.45%
jan 1, 2008
8.702
+0.611
7.55%
jan 1, 2009
3.411
-5.291
-60.8%
jan 1, 2010
1.256
-2.156
-63.19%
jan 1, 2011
8.343
+7.087
564.38%
jan 1, 2012
3.285
-5.057
-60.62%
jan 1, 2013
3.566
+0.281
8.55%
jan 1, 2014
3.576
+0.01
0.28%
Ranking of countries by current statistics by years