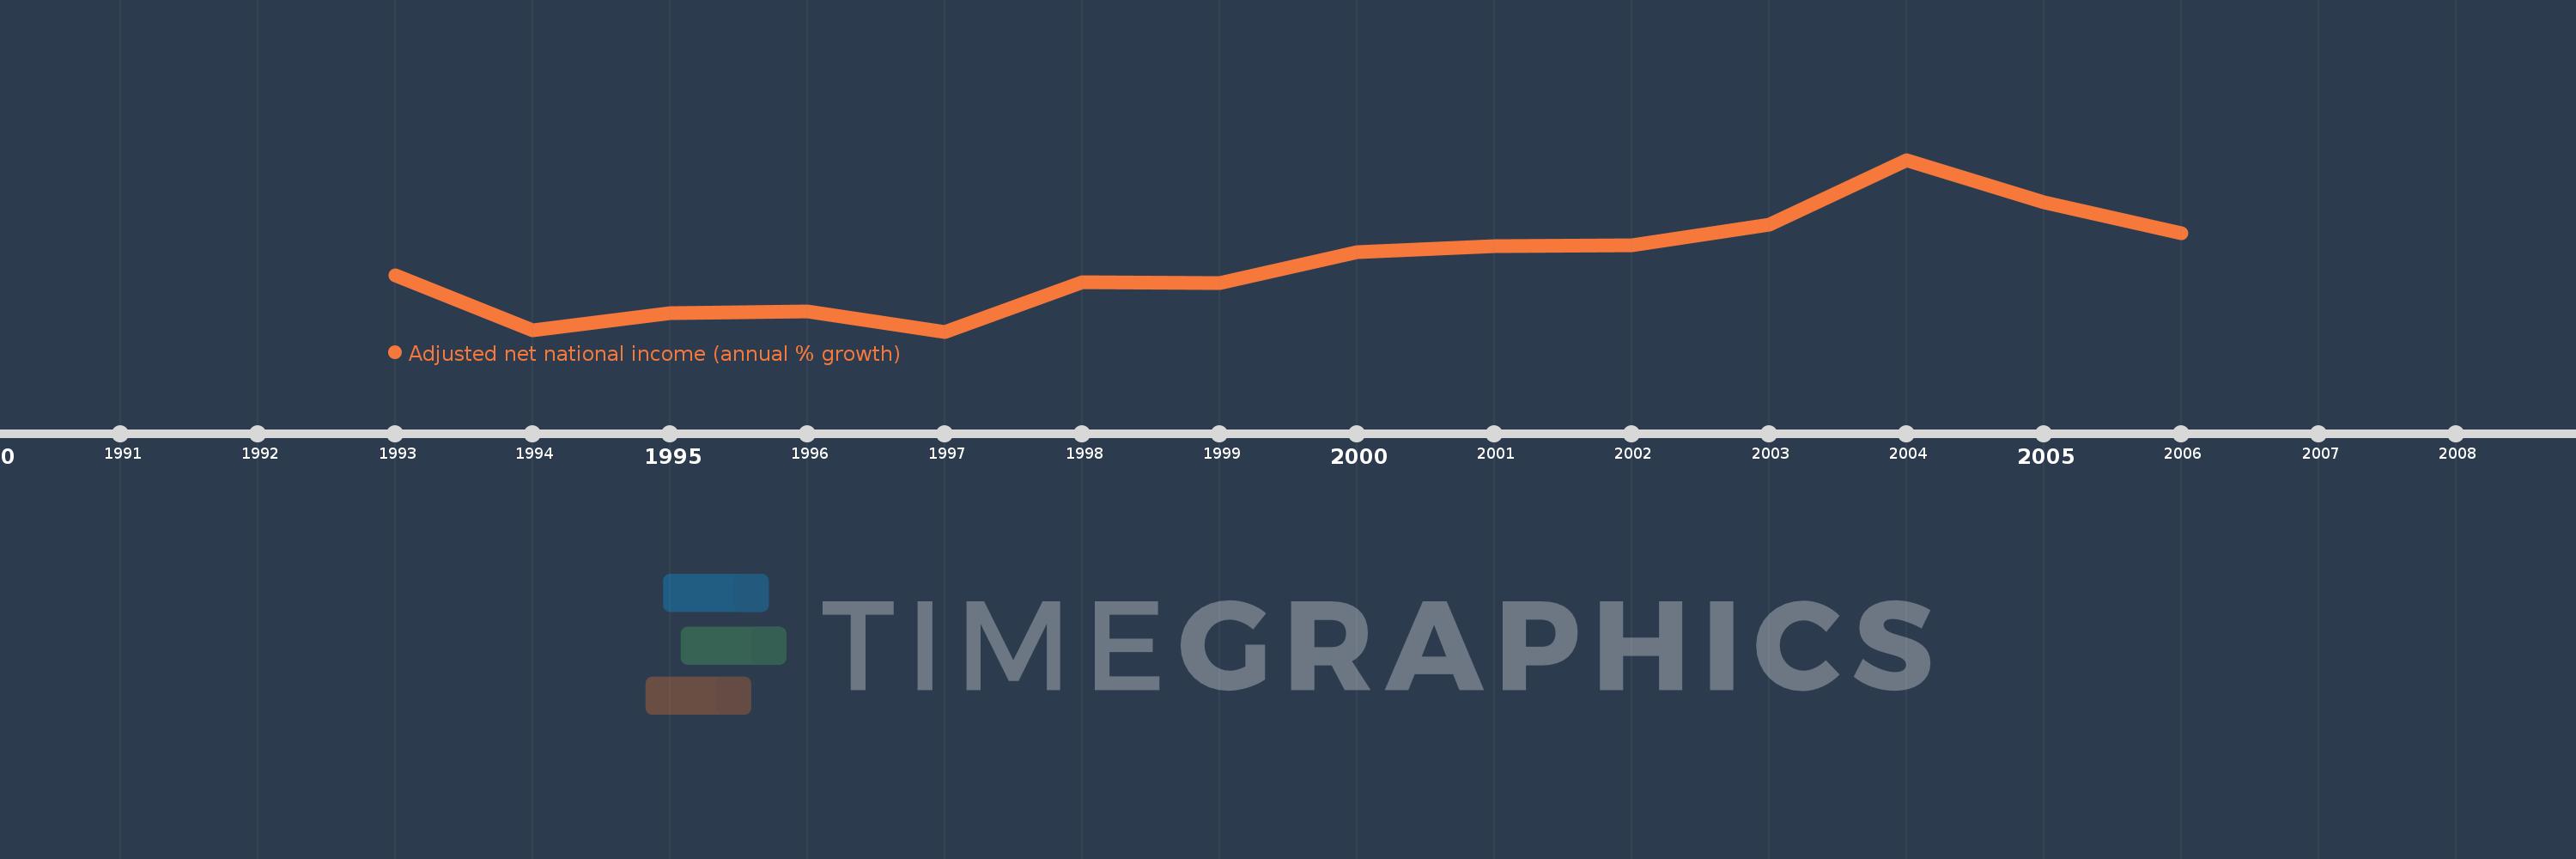
This timeline shows a graph from 1993 to 2006 of Djibouti. No data until 1992. Number of actual observations by date: 14.
Source name:
World Development Indicators
Source organization:
World Bank staff estimates based on sources and methods in World Bank's "The Changing Wealth of Nations: Measuring Sustainable Development in the New Millennium" (2011).
Categories, topics:
Economy & Growth
Last updated:
apr 23, 2017
Indicators value changes by year
Meaning:
0.326
Minimum:
-5.83
jan 1, 1997
Maximum:
9.729
jan 1, 2004
At the date of observation
Value
Absolute change
Change from the previous value
jan 1, 1993
-0.742
-0.742
0.0%
jan 1, 1994
-5.74
-4.998
673.28%
jan 1, 1995
-4.143
+1.597
-27.82%
jan 1, 1996
-4.014
+0.129
-3.11%
jan 1, 1997
-5.83
-1.816
45.23%
jan 1, 1998
-1.391
+4.439
-76.13%
jan 1, 1999
-1.396
-0.005
0.34%
jan 1, 2000
1.374
+2.77
-198.4%
jan 1, 2001
1.882
+0.508
36.95%
jan 1, 2002
2.027
+0.145
7.72%
jan 1, 2003
3.862
+1.835
90.54%
jan 1, 2004
9.729
+5.867
151.92%
jan 1, 2005
5.846
-3.883
-39.91%
jan 1, 2006
3.104
-2.742
-46.91%
Ranking of countries by current statistics by years