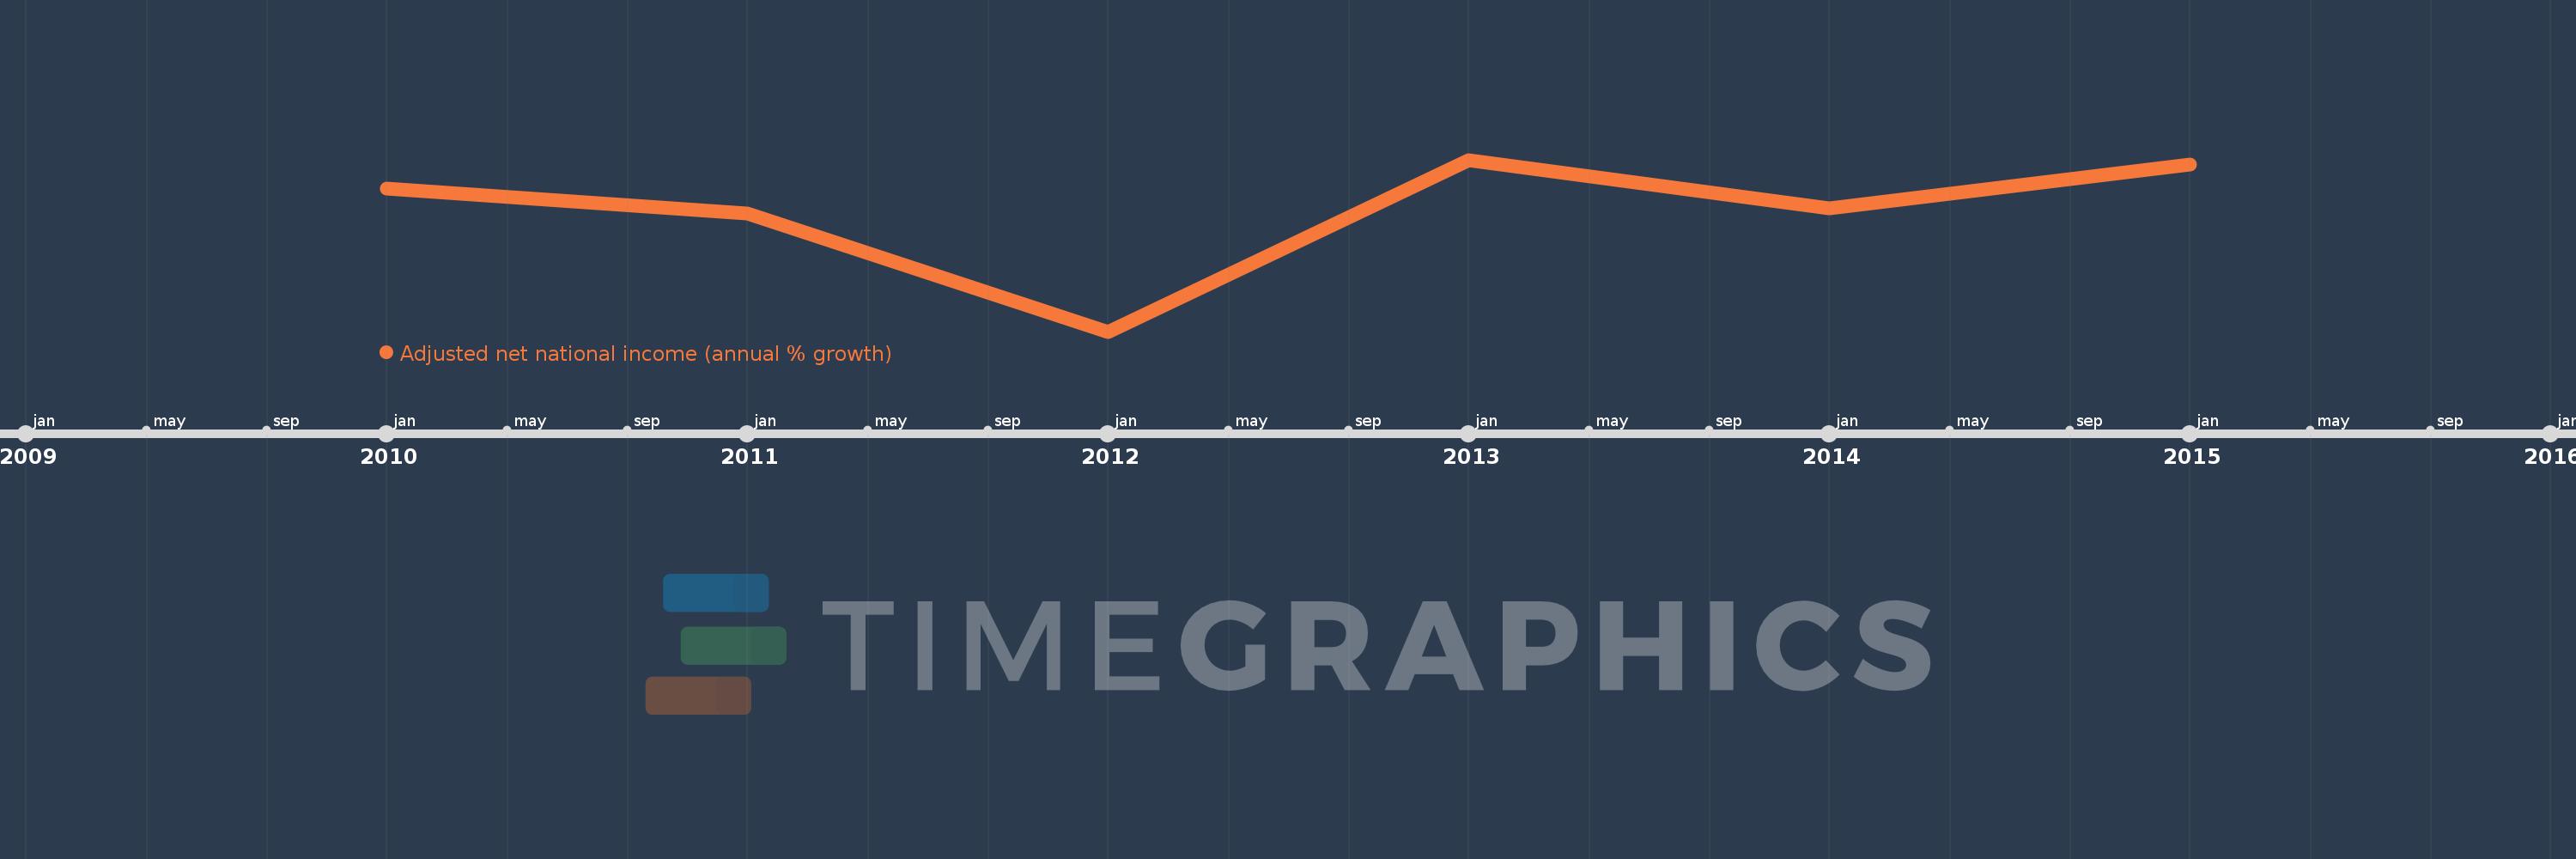
This timeline shows a graph from 2010 to 2015 of Cote d'Ivoire. No data until 2009. Number of actual observations by date: 6.
Source name:
World Development Indicators
Source organization:
World Bank staff estimates based on sources and methods in World Bank's "The Changing Wealth of Nations: Measuring Sustainable Development in the New Millennium" (2011).
Categories, topics:
Economy & Growth
Last updated:
apr 23, 2017
Indicators value changes by year
Meaning:
7.129
Minimum:
-8.518
jan 1, 2012
Maximum:
13.798
jan 1, 2013
At the date of observation
Value
Absolute change
Change from the previous value
jan 1, 2010
10.106
+10.106
0.0%
jan 1, 2011
6.784
-3.322
-32.87%
jan 1, 2012
-8.518
-15.303
-225.56%
jan 1, 2013
13.798
+22.316
-261.97%
jan 1, 2014
7.438
-6.359
-46.09%
jan 1, 2015
13.165
+5.726
76.99%
Ranking of countries by current statistics by years