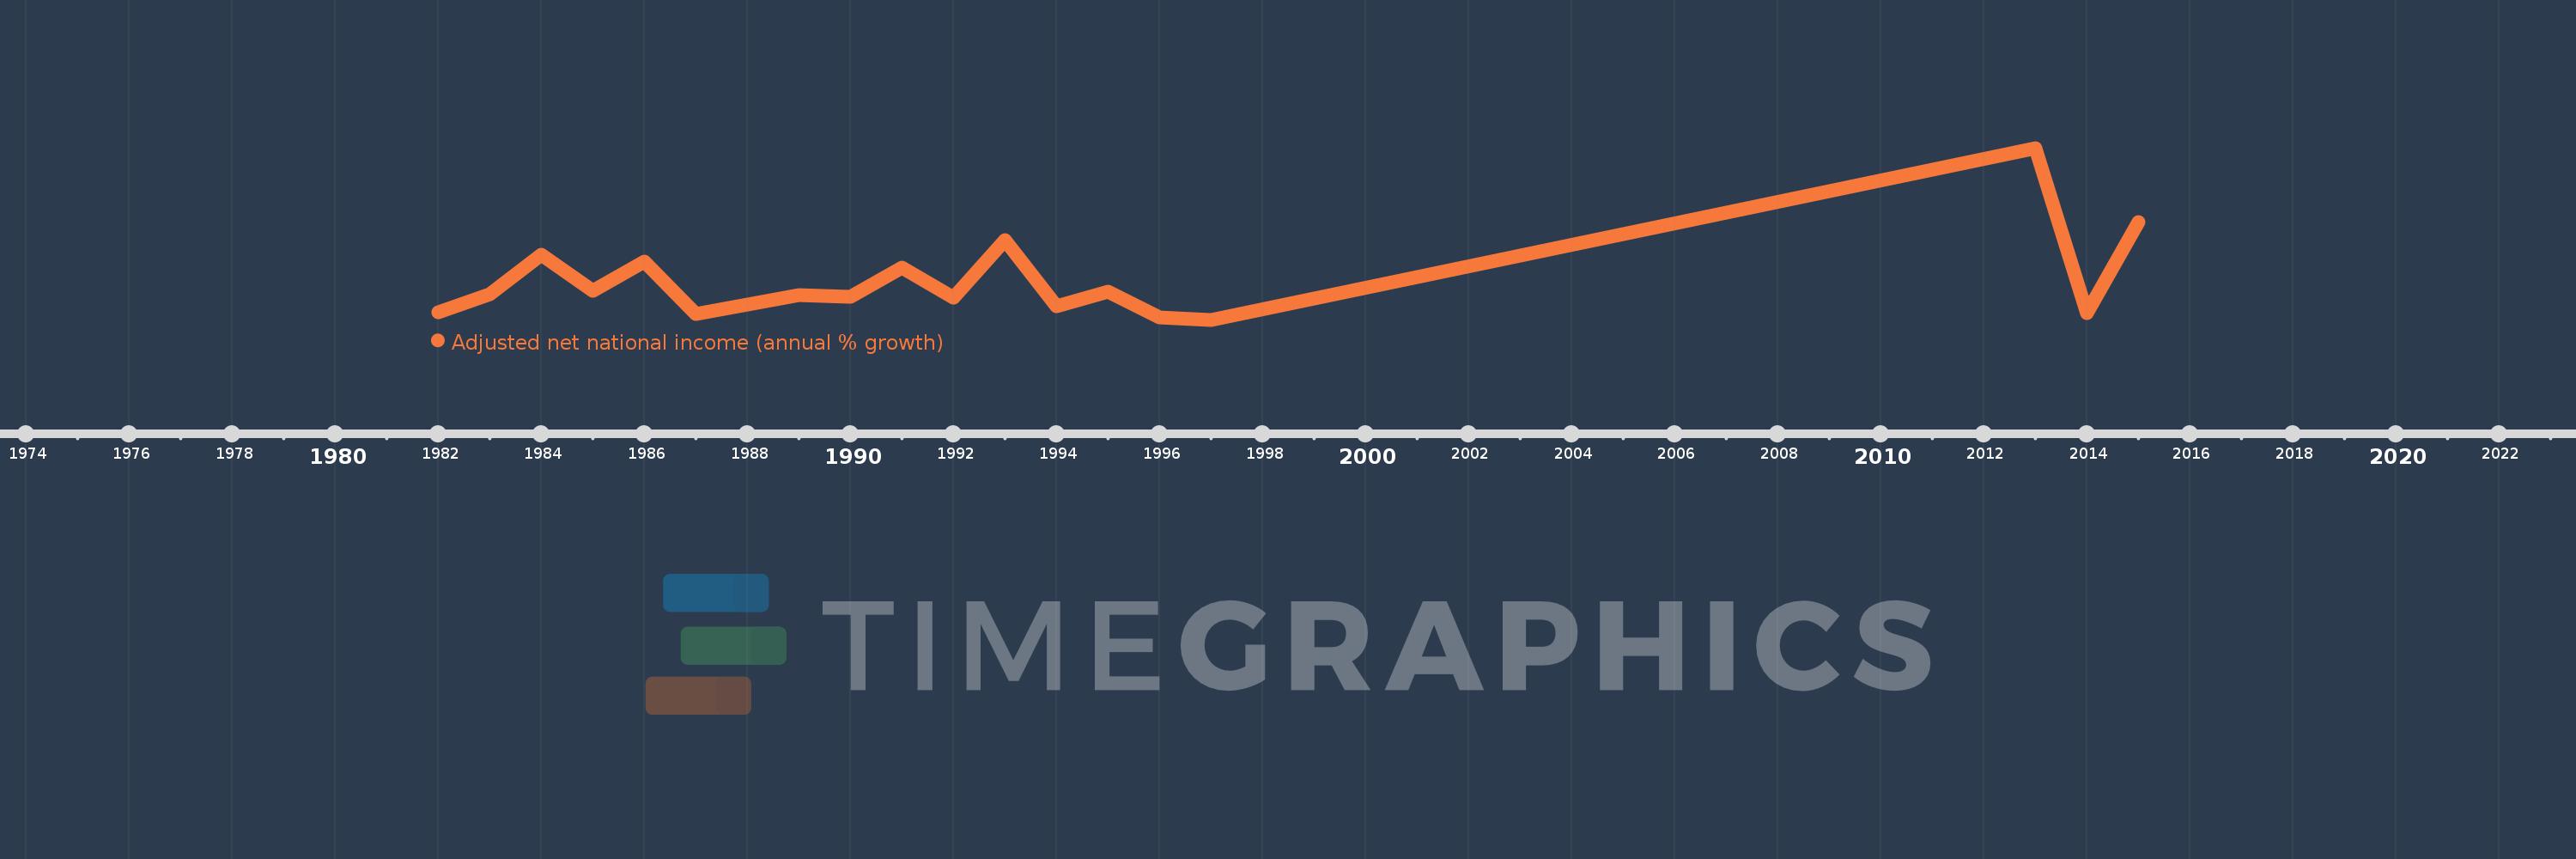
This timeline shows a graph from 1982 to 2015 of Equatorial Guinea. No data until 1981. Number of actual observations by date: 19.
Source name:
World Development Indicators
Source organization:
World Bank staff estimates based on sources and methods in World Bank's "The Changing Wealth of Nations: Measuring Sustainable Development in the New Millennium" (2011).
Categories, topics:
Economy & Growth
Last updated:
apr 23, 2017
Indicators value changes by year
Meaning:
10.567
Minimum:
-20.43
jan 1, 1997
Maximum:
118.578
jan 1, 2013
At the date of observation
Value
Absolute change
Change from the previous value
jan 1, 1982
-14.533
-14.533
0.0%
jan 1, 1983
0.244
+14.777
-101.68%
jan 1, 1984
32.441
+32.197
13.18K%
jan 1, 1985
2.656
-29.786
-91.81%
jan 1, 1986
26.959
+24.303
915.13%
jan 1, 1987
-15.551
-42.509
-157.68%
jan 1, 1988
-8.413
+7.138
-45.9%
jan 1, 1989
-0.195
+8.217
-97.68%
jan 1, 1990
-2.095
-1.9
972.37%
jan 1, 1991
21.954
+24.049
-1.15K%
jan 1, 1992
-2.696
-24.65
-112.28%
jan 1, 1993
44.228
+46.924
-1.74K%
jan 1, 1994
-9.37
-53.598
-121.19%
jan 1, 1995
2.403
+11.773
-125.64%
jan 1, 1996
-18.826
-21.229
-883.45%
jan 1, 1997
-20.43
-1.604
8.52%
jan 1, 2013
118.578
+139.008
-680.4%
jan 1, 2014
-15.403
-133.981
-112.99%
jan 1, 2015
58.832
+74.235
-481.95%
Ranking of countries by current statistics by years