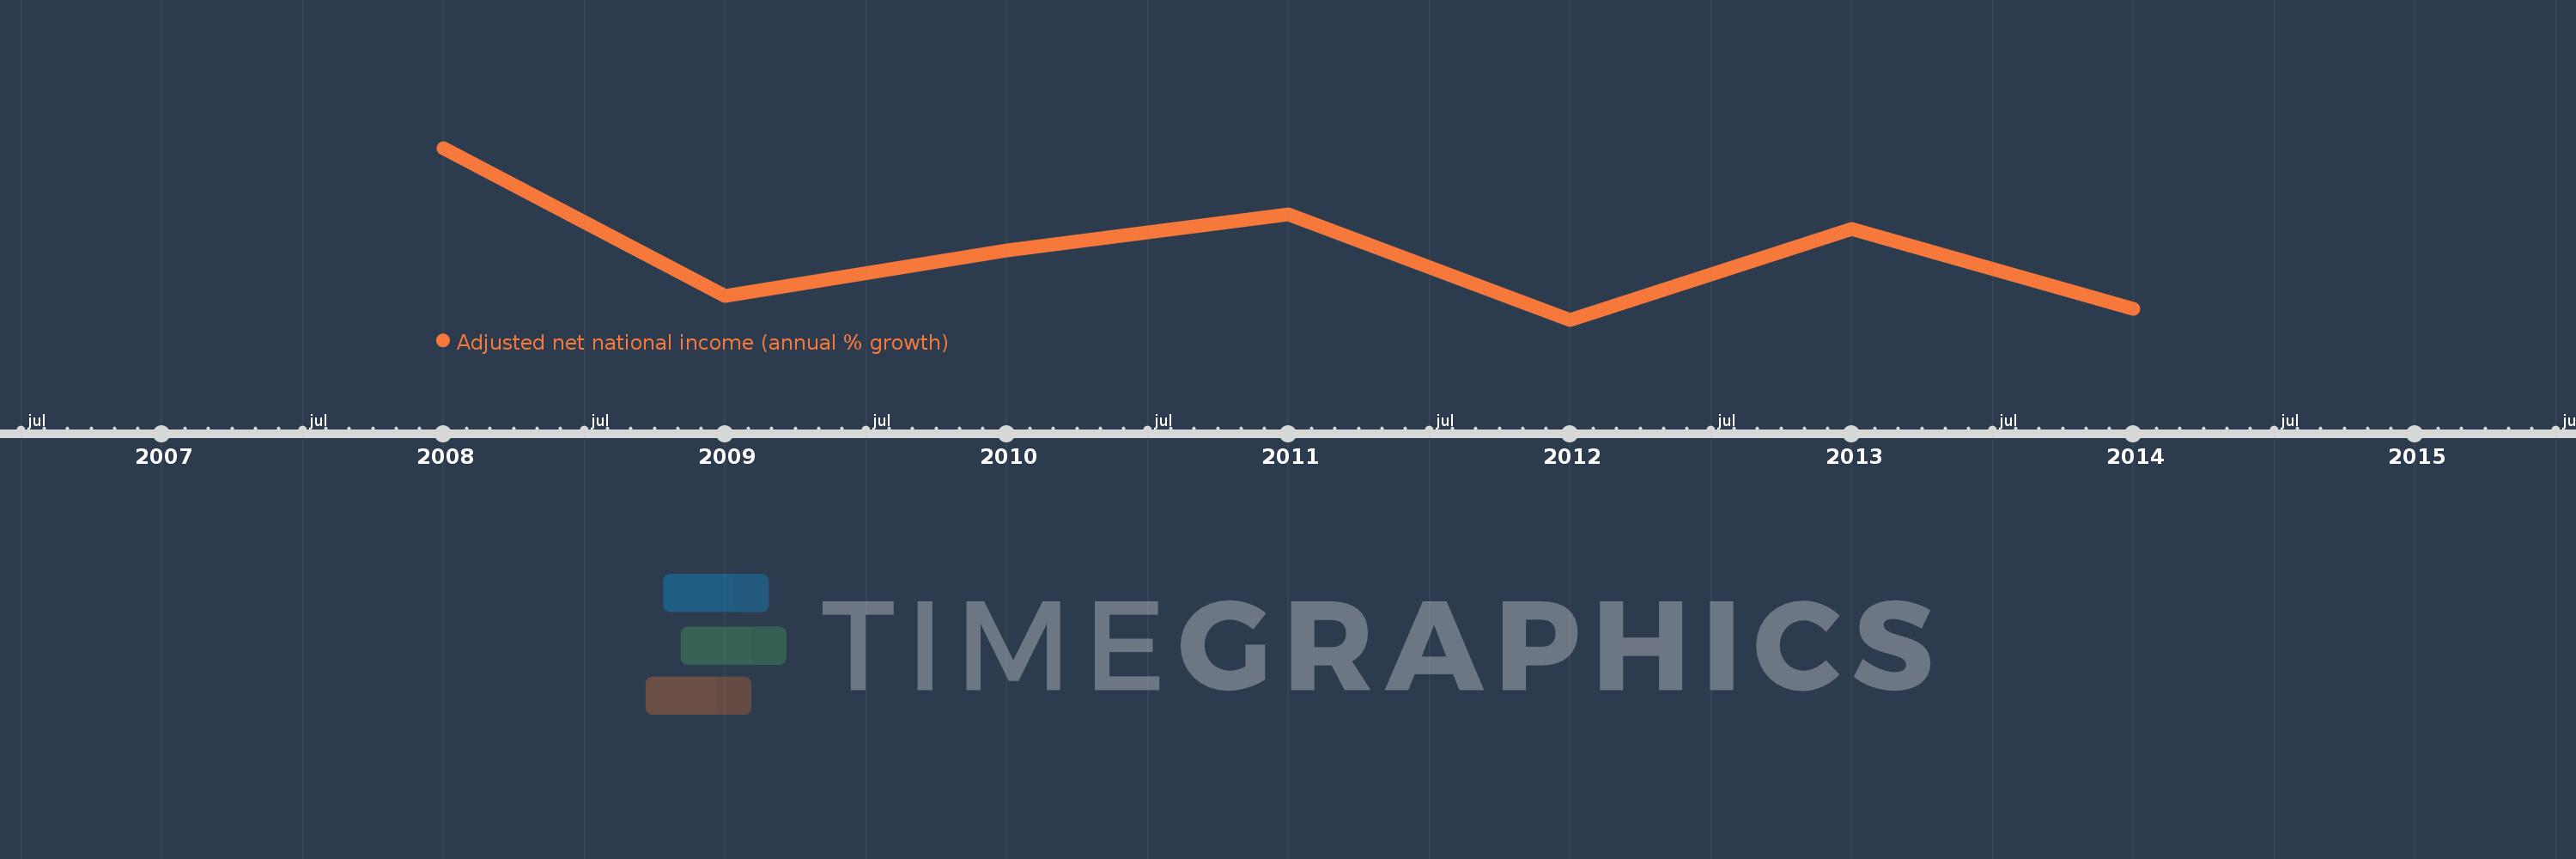
This timeline shows a graph from 2008 to 2014 of Bahrain. No data until 2007. Number of actual observations by date: 7.
Source name:
World Development Indicators
Source organization:
World Bank staff estimates based on sources and methods in World Bank's "The Changing Wealth of Nations: Measuring Sustainable Development in the New Millennium" (2011).
Categories, topics:
Economy & Growth
Last updated:
apr 23, 2017
Indicators value changes by year
Meaning:
7.412
Minimum:
-0.899
jan 1, 2012
Maximum:
20.261
jan 1, 2008
At the date of observation
Value
Absolute change
Change from the previous value
jan 1, 2008
20.261
+20.261
0.0%
jan 1, 2009
2.067
-18.194
-89.8%
jan 1, 2010
7.588
+5.52
267.01%
jan 1, 2011
12.117
+4.529
59.69%
jan 1, 2012
-0.899
-13.016
-107.42%
jan 1, 2013
10.271
+11.17
-1.24K%
jan 1, 2014
0.481
-9.79
-95.31%
Ranking of countries by current statistics by years