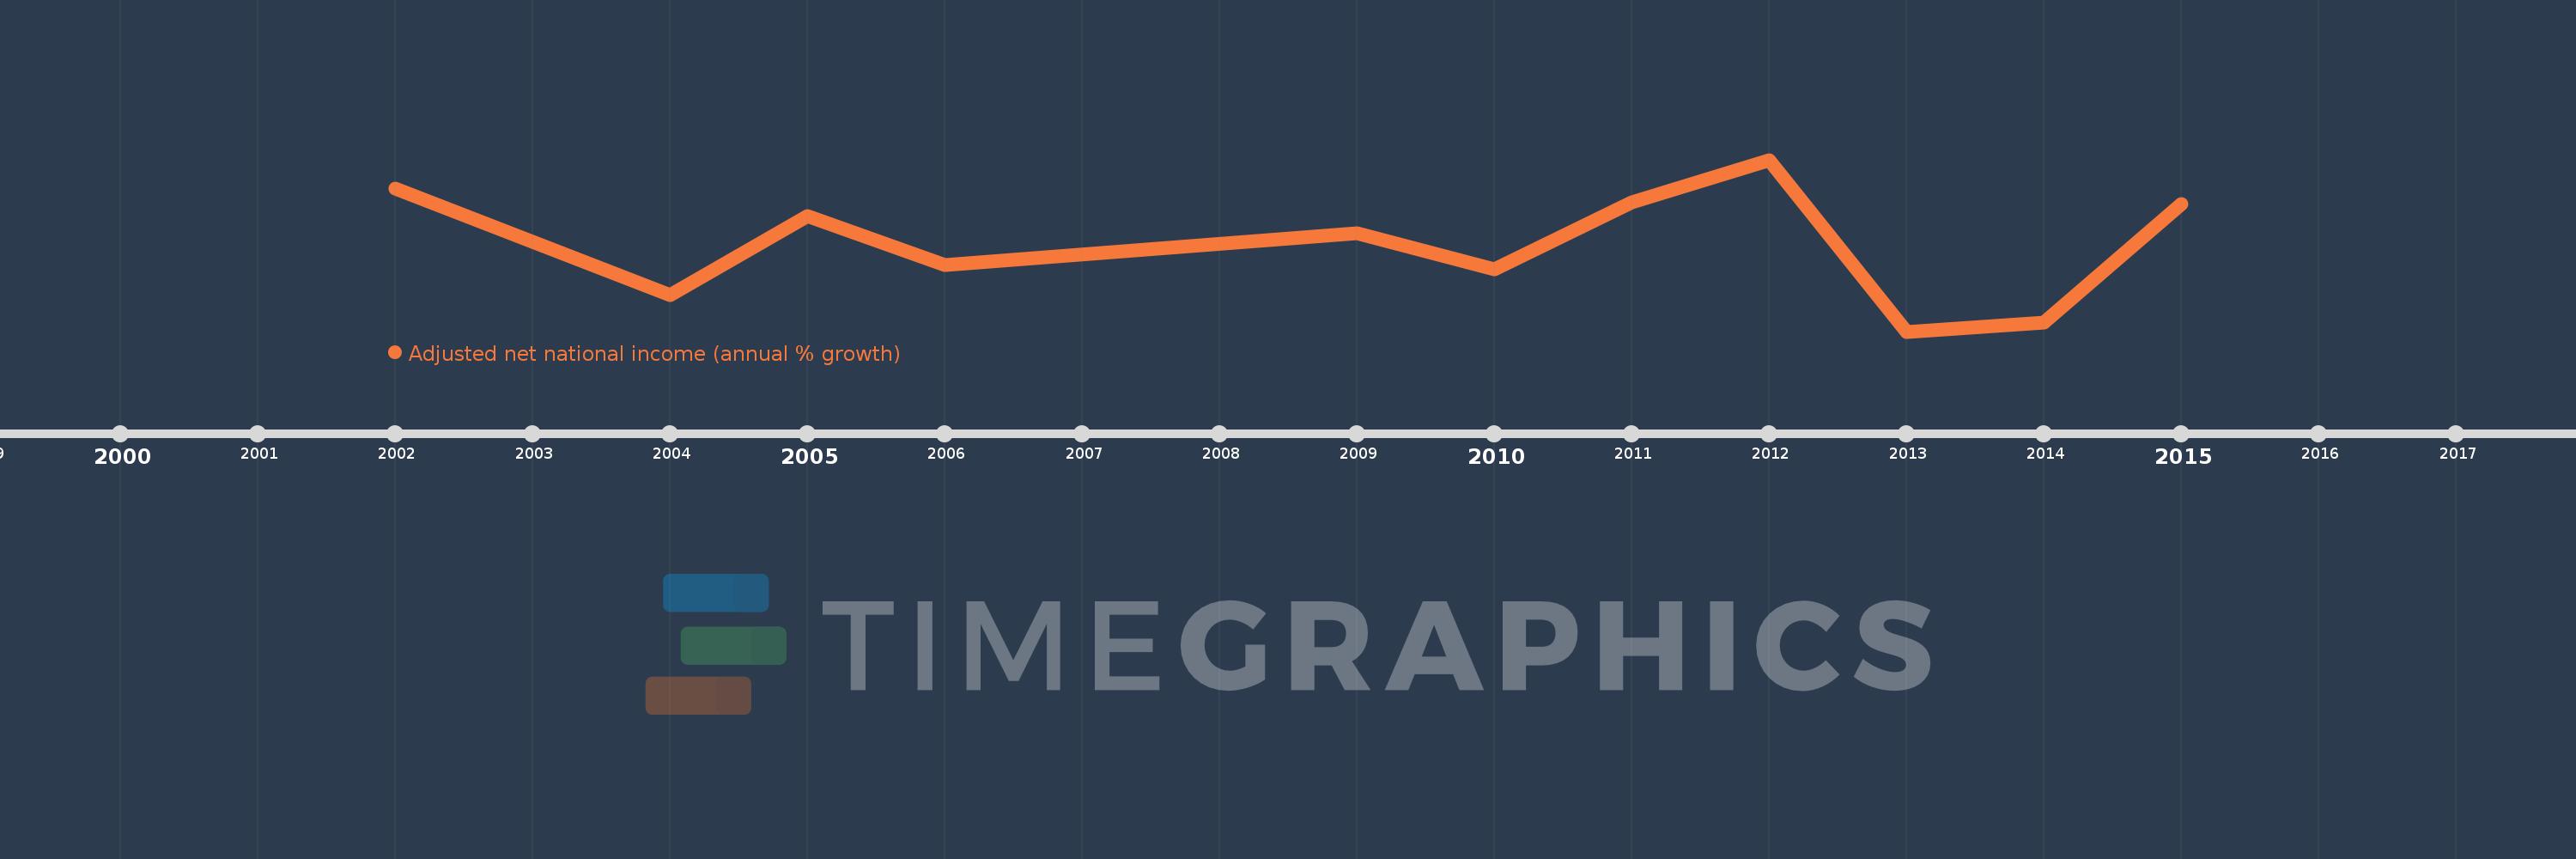
This timeline shows a graph from 2002 to 2015 of Guinea-Bissau. No data until 2001. Number of actual observations by date: 12.
Source name:
World Development Indicators
Source organization:
World Bank staff estimates based on sources and methods in World Bank's "The Changing Wealth of Nations: Measuring Sustainable Development in the New Millennium" (2011).
Categories, topics:
Economy & Growth
Last updated:
apr 23, 2017
Indicators value changes by year
Meaning:
2.201
Minimum:
-14.313
jan 1, 2013
Maximum:
18.132
jan 1, 2012
At the date of observation
Value
Absolute change
Change from the previous value
jan 1, 2002
12.685
+12.685
0.0%
jan 1, 2003
2.679
-10.006
-78.88%
jan 1, 2004
-7.481
-10.16
-379.29%
jan 1, 2005
7.488
+14.969
-200.09%
jan 1, 2006
-1.66
-9.148
-122.17%
jan 1, 2009
4.334
+5.994
-361.01%
jan 1, 2010
-2.597
-6.931
-159.93%
jan 1, 2011
10.036
+12.633
-486.38%
jan 1, 2012
18.132
+8.096
80.67%
jan 1, 2013
-14.313
-32.445
-178.94%
jan 1, 2014
-12.59
+1.724
-12.04%
jan 1, 2015
9.698
+22.287
-177.03%
Ranking of countries by current statistics by years