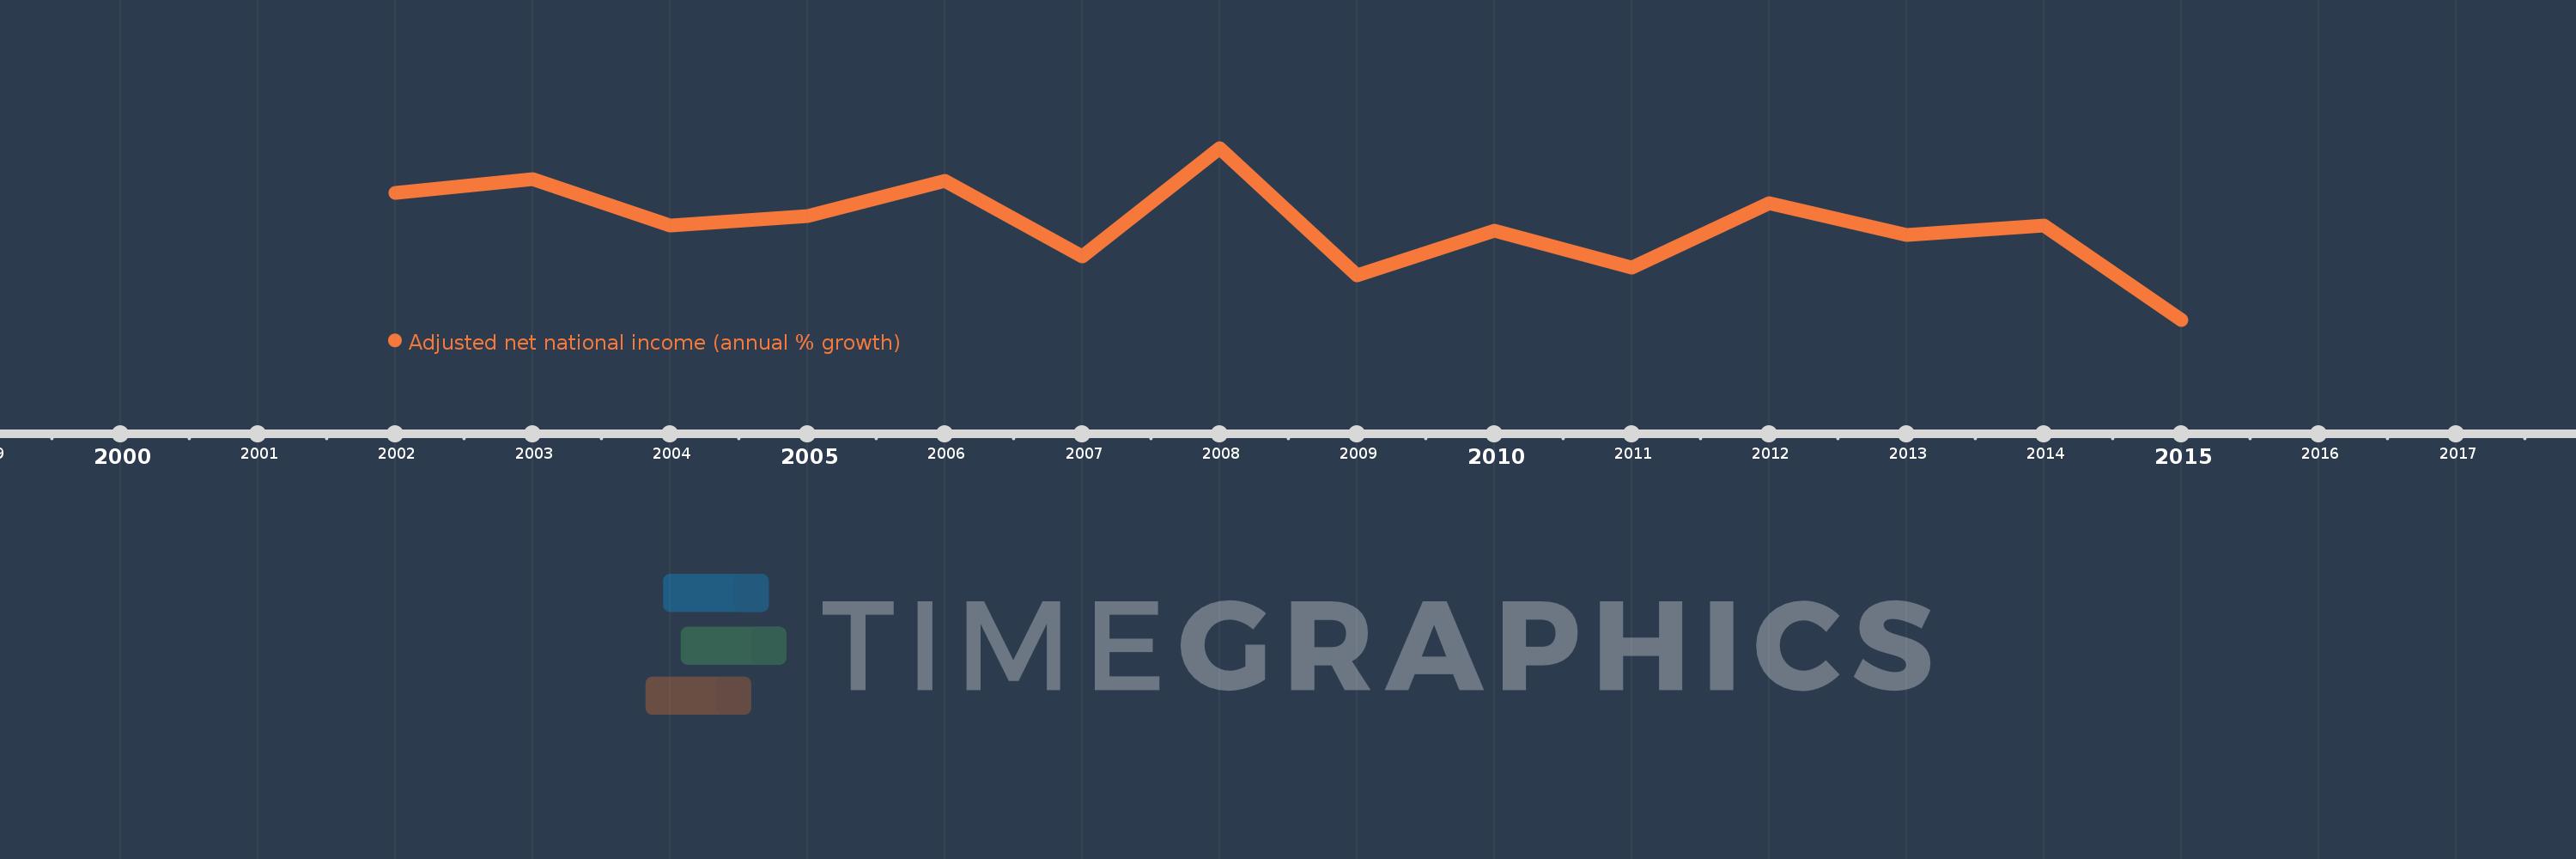
This timeline shows a graph from 2002 to 2015 of Bhutan. No data until 2001. Number of actual observations by date: 14.
Source name:
World Development Indicators
Source organization:
World Bank staff estimates based on sources and methods in World Bank's "The Changing Wealth of Nations: Measuring Sustainable Development in the New Millennium" (2011).
Categories, topics:
Economy & Growth
Last updated:
apr 23, 2017
Indicators value changes by year
Meaning:
6.546
Minimum:
-2.31
jan 1, 2015
Maximum:
13.814
jan 1, 2008
At the date of observation
Value
Absolute change
Change from the previous value
jan 1, 2002
9.629
+9.629
0.0%
jan 1, 2003
10.899
+1.27
13.19%
jan 1, 2004
6.522
-4.377
-40.16%
jan 1, 2005
7.438
+0.916
14.04%
jan 1, 2006
10.686
+3.248
43.68%
jan 1, 2007
3.664
-7.022
-65.72%
jan 1, 2008
13.814
+10.15
277.06%
jan 1, 2009
1.887
-11.927
-86.34%
jan 1, 2010
6.036
+4.149
219.86%
jan 1, 2011
2.577
-3.46
-57.31%
jan 1, 2012
8.646
+6.069
235.55%
jan 1, 2013
5.642
-3.004
-34.74%
jan 1, 2014
6.518
+0.876
15.53%
jan 1, 2015
-2.31
-8.828
-135.43%
Ranking of countries by current statistics by years