Download This statistics in other country:
Timeline:
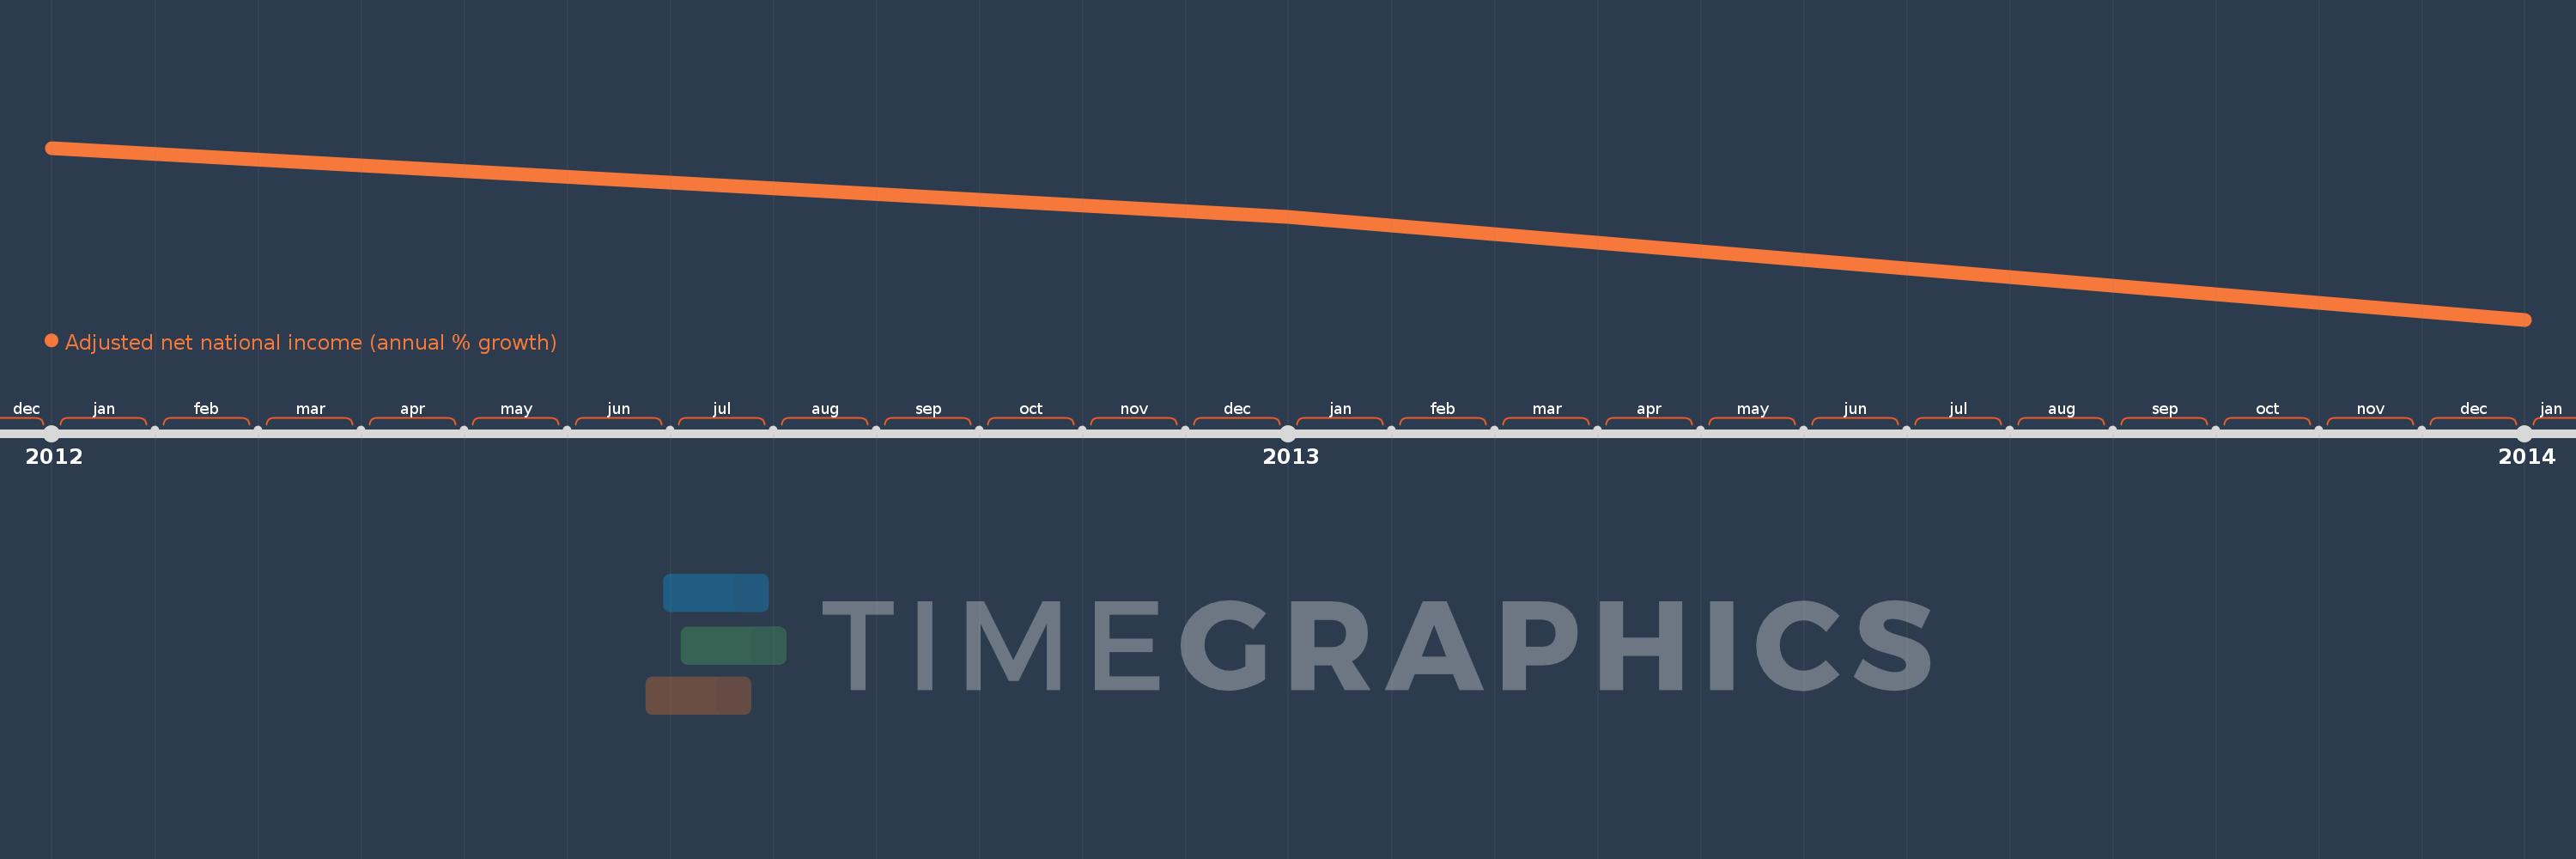
This timeline shows a graph from 2012 to 2014 of Arab World. No data until 2011. Number of actual observations by date: 3.
Source name:
World Development Indicators
Source organization:
World Bank staff estimates based on sources and methods in World Bank's "The Changing Wealth of Nations: Measuring Sustainable Development in the New Millennium" (2011).
Categories, topics:
Economy & Growth
Last updated:
apr 23, 2017
Indicators value changes by year
At the date of observation
Value
Absolute change
Change from the previous value
jan 1, 2012
9.525
+9.525
0.0%
jan 1, 2013
6.706
-2.818
-29.59%
jan 1, 2014
2.499
-4.207
-62.73%
Ranking of countries by current statistics by years