Download This statistics in other country:
Timeline:
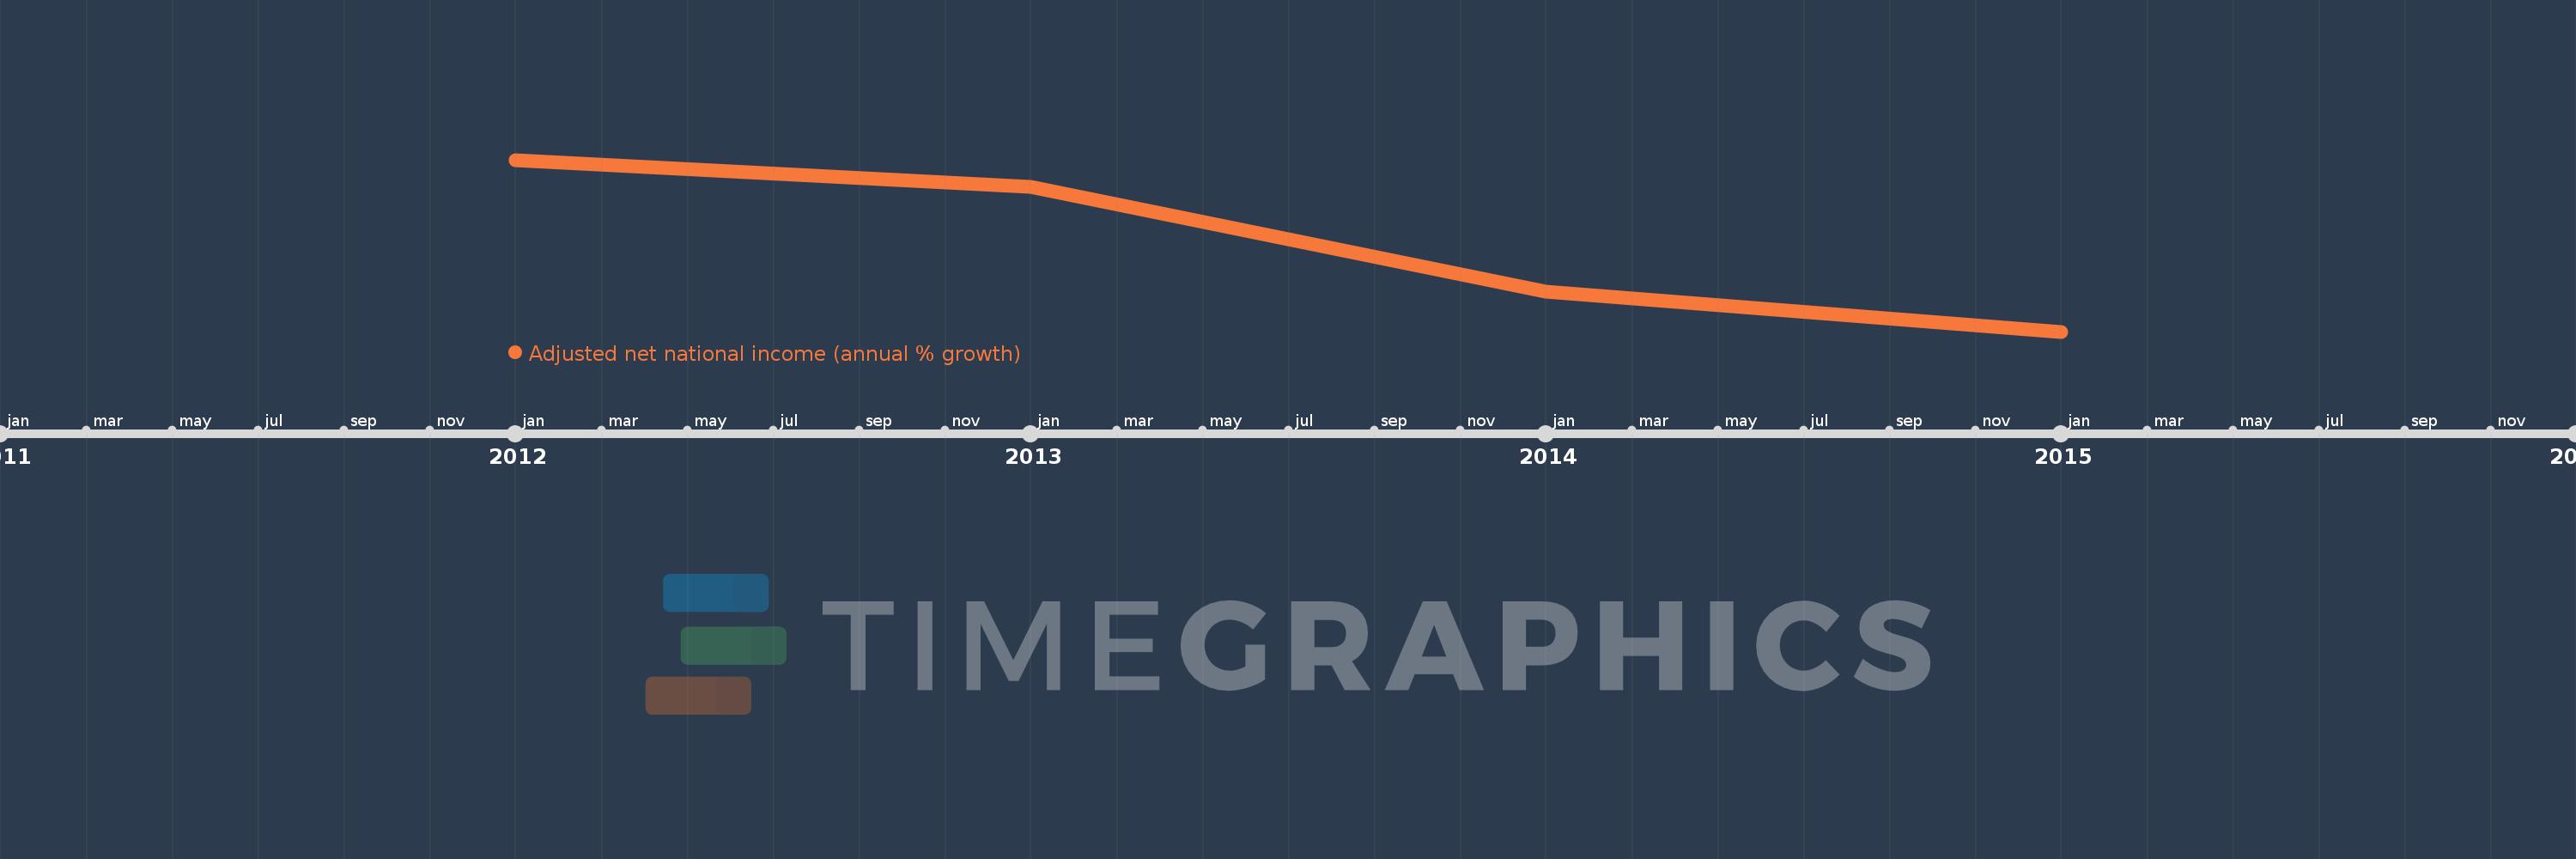
This timeline shows a graph from 2012 to 2015 of Kuwait. No data until 2011. Number of actual observations by date: 4.
Source name:
World Development Indicators
Source organization:
World Bank staff estimates based on sources and methods in World Bank's "The Changing Wealth of Nations: Measuring Sustainable Development in the New Millennium" (2011).
Categories, topics:
Economy & Growth
Last updated:
apr 23, 2017
Indicators value changes by year
Maximum:
18.465
jan 1, 2012
At the date of observation
Value
Absolute change
Change from the previous value
jan 1, 2012
18.465
+18.465
0.0%
jan 1, 2013
14.582
-3.883
-21.03%
jan 1, 2014
-0.171
-14.753
-101.17%
jan 1, 2015
-5.89
-5.719
3.35K%
Ranking of countries by current statistics by years