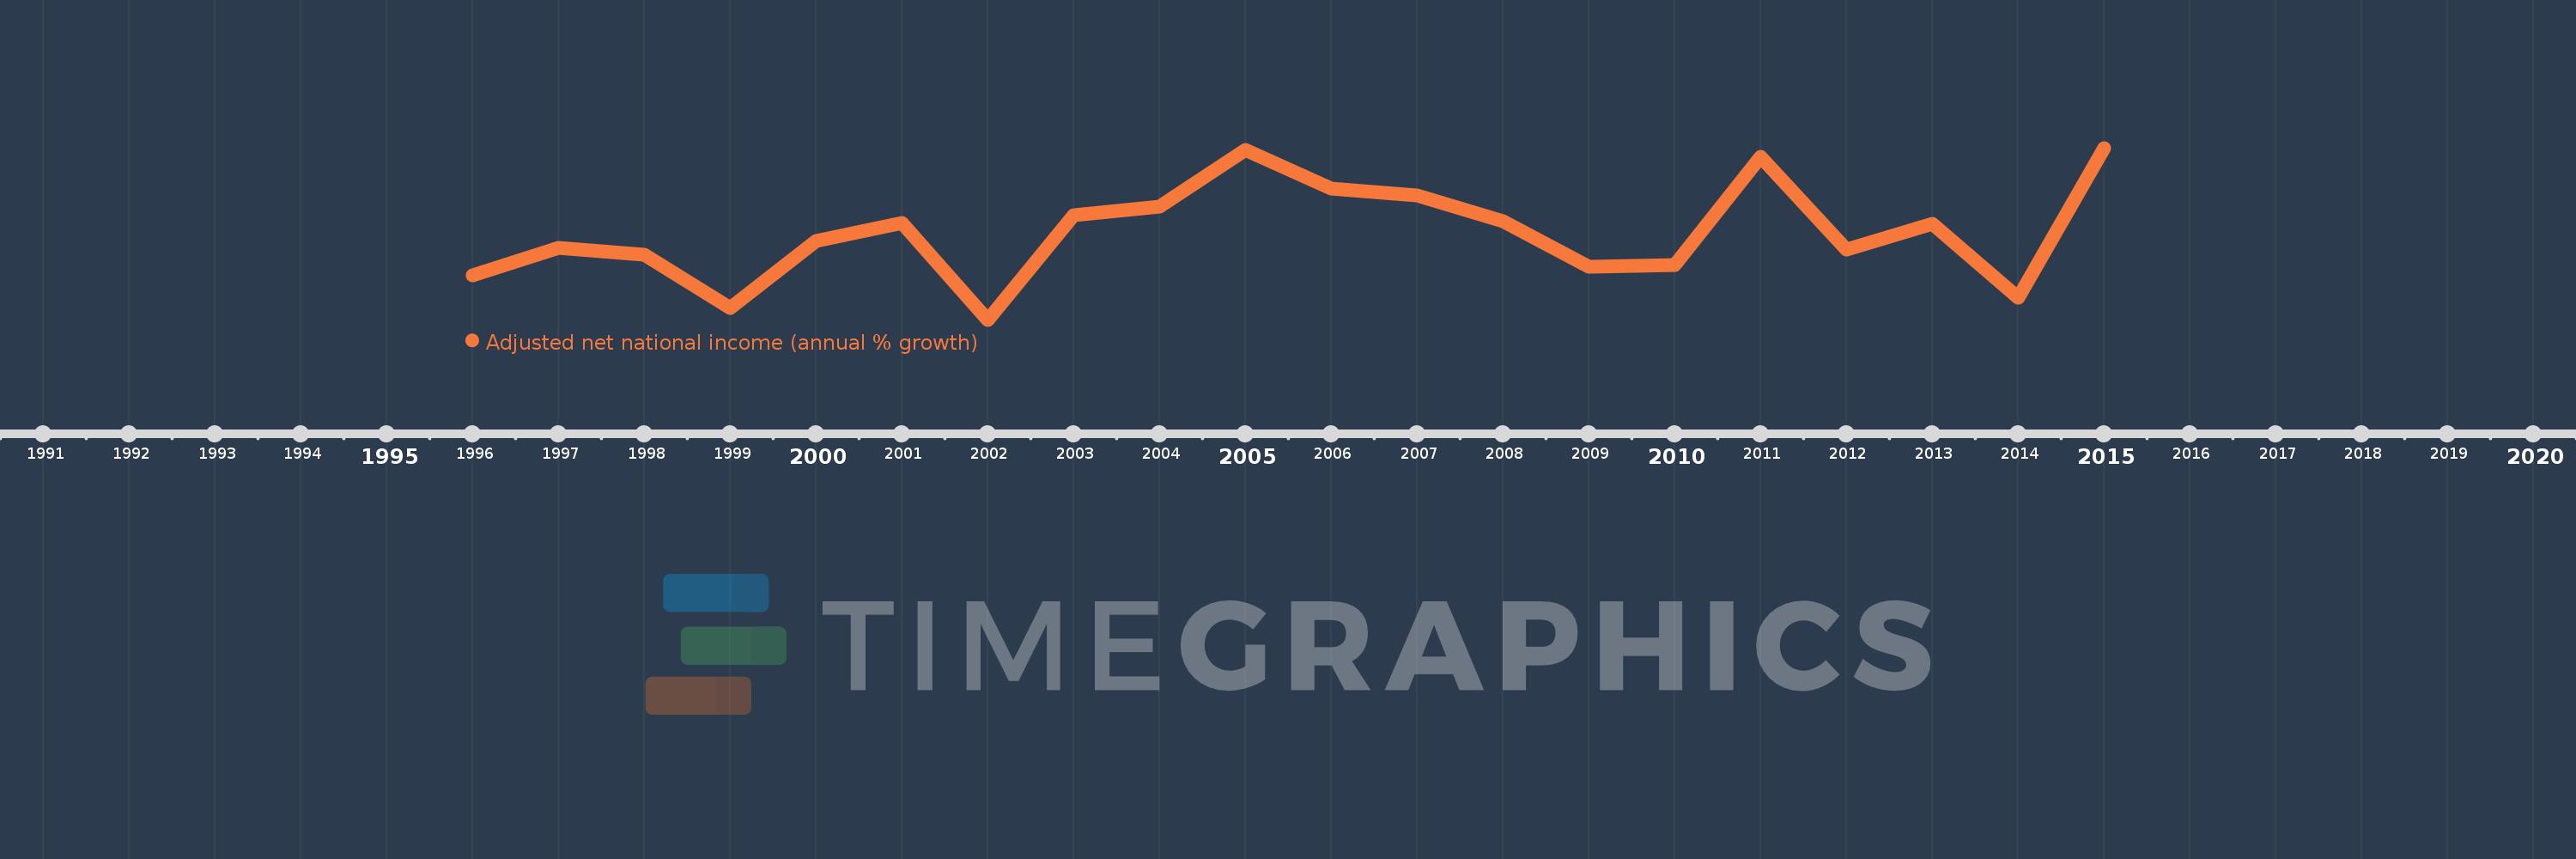
This timeline shows a graph from 1996 to 2015 of Congo, Dem. Rep.. No data until 1995. Number of actual observations by date: 20.
Source name:
World Development Indicators
Source organization:
World Bank staff estimates based on sources and methods in World Bank's "The Changing Wealth of Nations: Measuring Sustainable Development in the New Millennium" (2011).
Categories, topics:
Economy & Growth
Last updated:
apr 23, 2017
Indicators value changes by year
Meaning:
0.522
Minimum:
-8.983
jan 1, 2002
Maximum:
9.753
jan 1, 2015
At the date of observation
Value
Absolute change
Change from the previous value
jan 1, 1996
-4.121
-4.121
0.0%
jan 1, 1997
-1.116
+3.006
-72.93%
jan 1, 1998
-1.887
-0.771
69.09%
jan 1, 1999
-7.654
-5.768
305.69%
jan 1, 2000
-0.421
+7.233
-94.5%
jan 1, 2001
1.563
+1.984
-471.04%
jan 1, 2002
-8.983
-10.546
-674.74%
jan 1, 2003
2.391
+11.374
-126.61%
jan 1, 2004
3.39
+0.999
41.79%
jan 1, 2005
9.577
+6.187
182.54%
jan 1, 2006
5.319
-4.258
-44.46%
jan 1, 2007
4.615
-0.704
-13.23%
jan 1, 2008
1.806
-2.809
-60.87%
jan 1, 2009
-3.189
-4.995
-276.6%
jan 1, 2010
-2.994
+0.194
-6.1%
jan 1, 2011
8.805
+11.8
-394.05%
jan 1, 2012
-1.348
-10.154
-115.31%
jan 1, 2013
1.509
+2.857
-211.92%
jan 1, 2014
-6.569
-8.078
-535.32%
jan 1, 2015
9.753
+16.322
-248.46%
Ranking of countries by current statistics by years