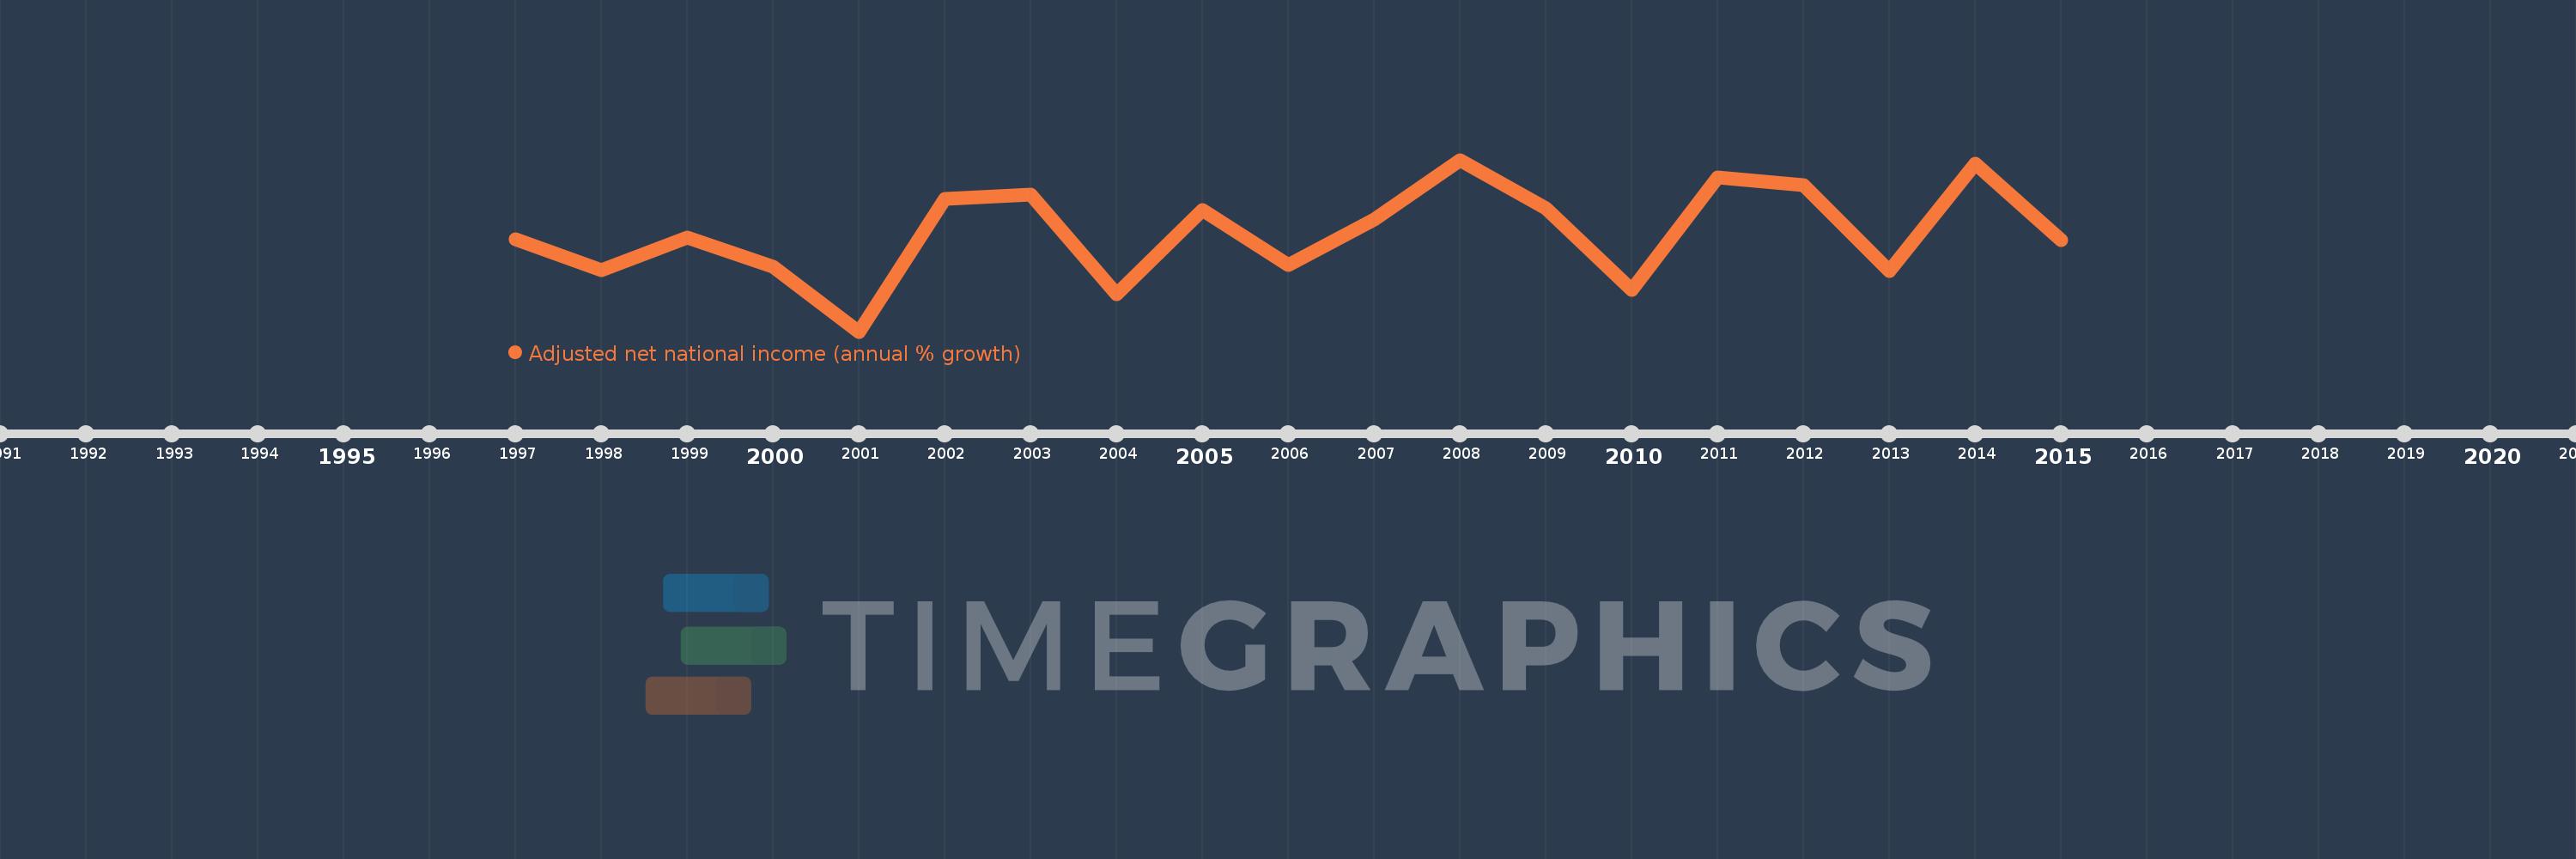
This timeline shows a graph from 1997 to 2015 of Paraguay. No data until 1996. Number of actual observations by date: 19.
Source name:
World Development Indicators
Source organization:
World Bank staff estimates based on sources and methods in World Bank's "The Changing Wealth of Nations: Measuring Sustainable Development in the New Millennium" (2011).
Categories, topics:
Economy & Growth
Last updated:
apr 23, 2017
Indicators value changes by year
Meaning:
3.491
Minimum:
-11.085
jan 1, 2001
Maximum:
14.254
jan 1, 2008
At the date of observation
Value
Absolute change
Change from the previous value
jan 1, 1997
2.595
+2.595
0.0%
jan 1, 1998
-1.969
-4.565
-175.88%
jan 1, 1999
2.802
+4.771
-242.26%
jan 1, 2000
-1.48
-4.281
-152.82%
jan 1, 2001
-11.085
-9.605
649.06%
jan 1, 2002
8.487
+19.572
-176.56%
jan 1, 2003
9.084
+0.597
7.04%
jan 1, 2004
-5.537
-14.621
-160.95%
jan 1, 2005
6.814
+12.351
-223.08%
jan 1, 2006
-1.282
-8.096
-118.81%
jan 1, 2007
5.505
+6.787
-529.48%
jan 1, 2008
14.254
+8.749
158.92%
jan 1, 2009
7.133
-7.121
-49.96%
jan 1, 2010
-4.945
-12.078
-169.33%
jan 1, 2011
11.601
+16.546
-334.58%
jan 1, 2012
10.476
-1.125
-9.7%
jan 1, 2013
-2.177
-12.653
-120.78%
jan 1, 2014
13.709
+15.886
-729.85%
jan 1, 2015
2.351
-11.358
-82.85%
Ranking of countries by current statistics by years