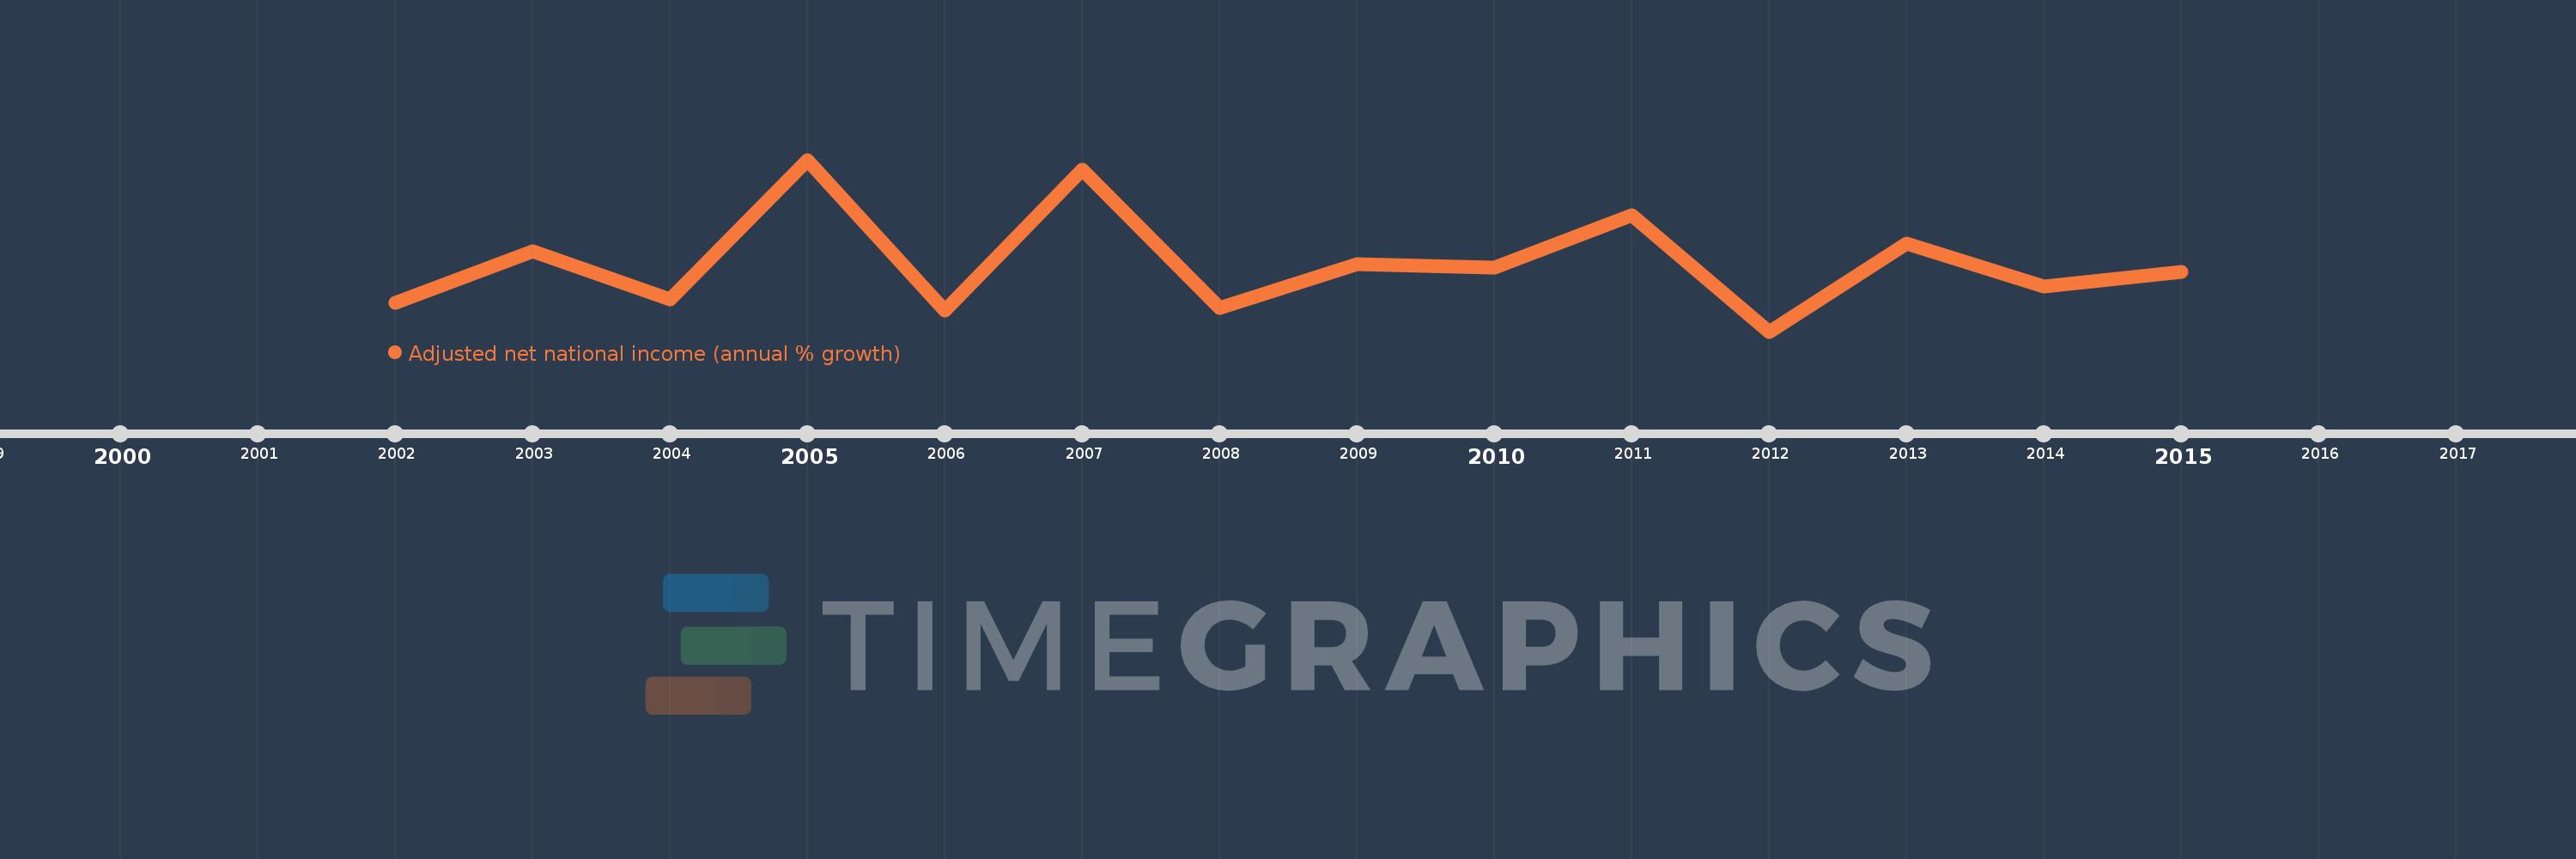
This timeline shows a graph from 2002 to 2015 of Pre-demographic dividend. No data until 2001. Number of actual observations by date: 14.
Source name:
World Development Indicators
Source organization:
World Bank staff estimates based on sources and methods in World Bank's "The Changing Wealth of Nations: Measuring Sustainable Development in the New Millennium" (2011).
Categories, topics:
Economy & Growth
Last updated:
apr 23, 2017
Indicators value changes by year
Meaning:
7.52
Minimum:
-1.451
jan 1, 2012
Maximum:
21.015
jan 1, 2005
At the date of observation
Value
Absolute change
Change from the previous value
jan 1, 2002
2.295
+2.295
0.0%
jan 1, 2003
9.074
+6.779
295.35%
jan 1, 2004
2.713
-6.361
-70.1%
jan 1, 2005
21.015
+18.301
674.55%
jan 1, 2006
1.347
-19.668
-93.59%
jan 1, 2007
19.776
+18.429
1.37K%
jan 1, 2008
1.585
-18.191
-91.98%
jan 1, 2009
7.317
+5.732
361.6%
jan 1, 2010
6.937
-0.38
-5.19%
jan 1, 2011
13.778
+6.841
98.62%
jan 1, 2012
-1.451
-15.229
-110.53%
jan 1, 2013
10.035
+11.486
-791.59%
jan 1, 2014
4.462
-5.573
-55.53%
jan 1, 2015
6.401
+1.939
43.44%
Ranking of countries by current statistics by years