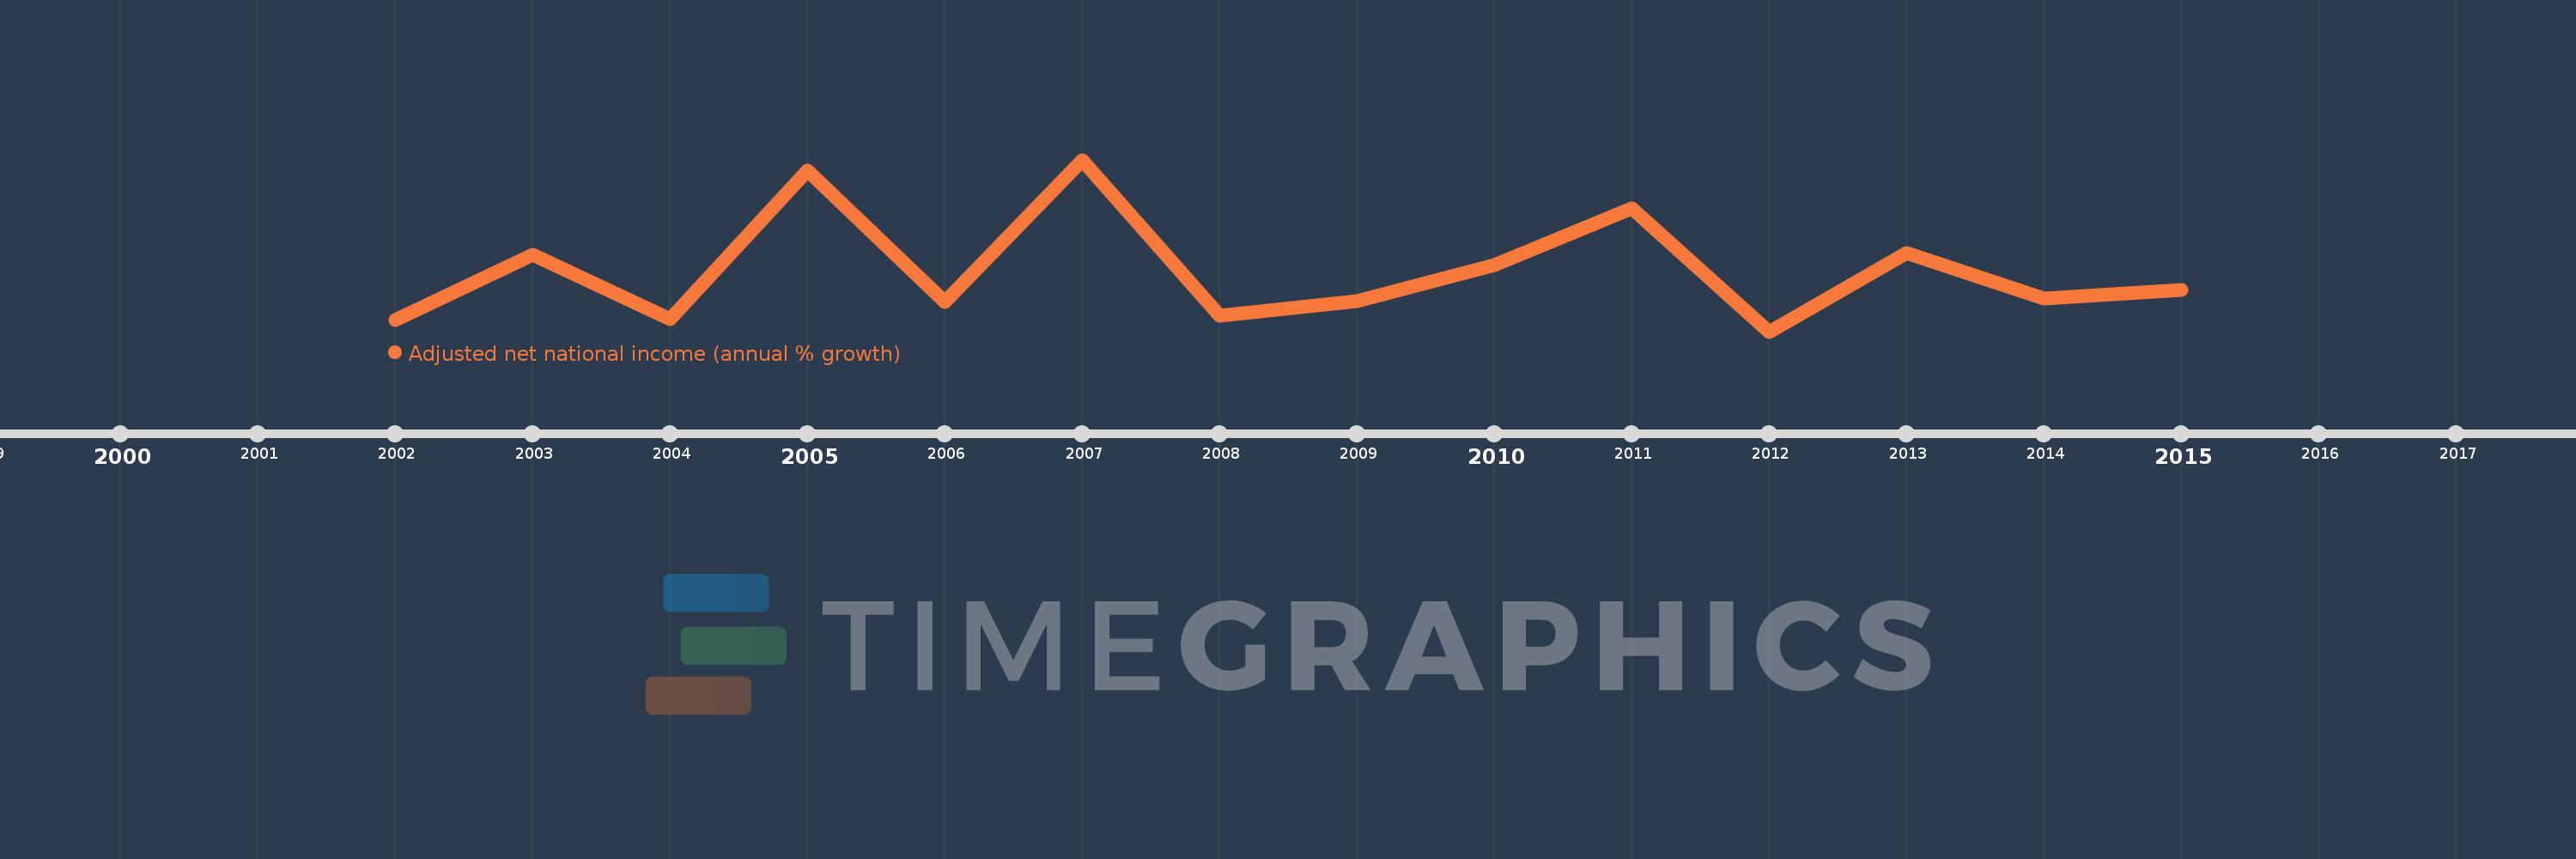
This timeline shows a graph from 2002 to 2015 of Sub-Saharan Africa . No data until 2001. Number of actual observations by date: 14.
Source name:
World Development Indicators
Source organization:
World Bank staff estimates based on sources and methods in World Bank's "The Changing Wealth of Nations: Measuring Sustainable Development in the New Millennium" (2011).
Categories, topics:
Economy & Growth
Last updated:
apr 23, 2017
Indicators value changes by year
Meaning:
5.611
Minimum:
1.632
jan 1, 2012
Maximum:
12.842
jan 1, 2007
At the date of observation
Value
Absolute change
Change from the previous value
jan 1, 2002
2.41
+2.41
0.0%
jan 1, 2003
6.633
+4.223
175.2%
jan 1, 2004
2.431
-4.203
-63.35%
jan 1, 2005
12.15
+9.719
399.8%
jan 1, 2006
3.574
-8.576
-70.59%
jan 1, 2007
12.842
+9.268
259.35%
jan 1, 2008
2.685
-10.156
-79.09%
jan 1, 2009
3.629
+0.944
35.14%
jan 1, 2010
5.994
+2.365
65.17%
jan 1, 2011
9.68
+3.686
61.49%
jan 1, 2012
1.632
-8.047
-83.14%
jan 1, 2013
6.788
+5.156
315.85%
jan 1, 2014
3.765
-3.023
-44.53%
jan 1, 2015
4.344
+0.579
15.38%
Ranking of countries by current statistics by years