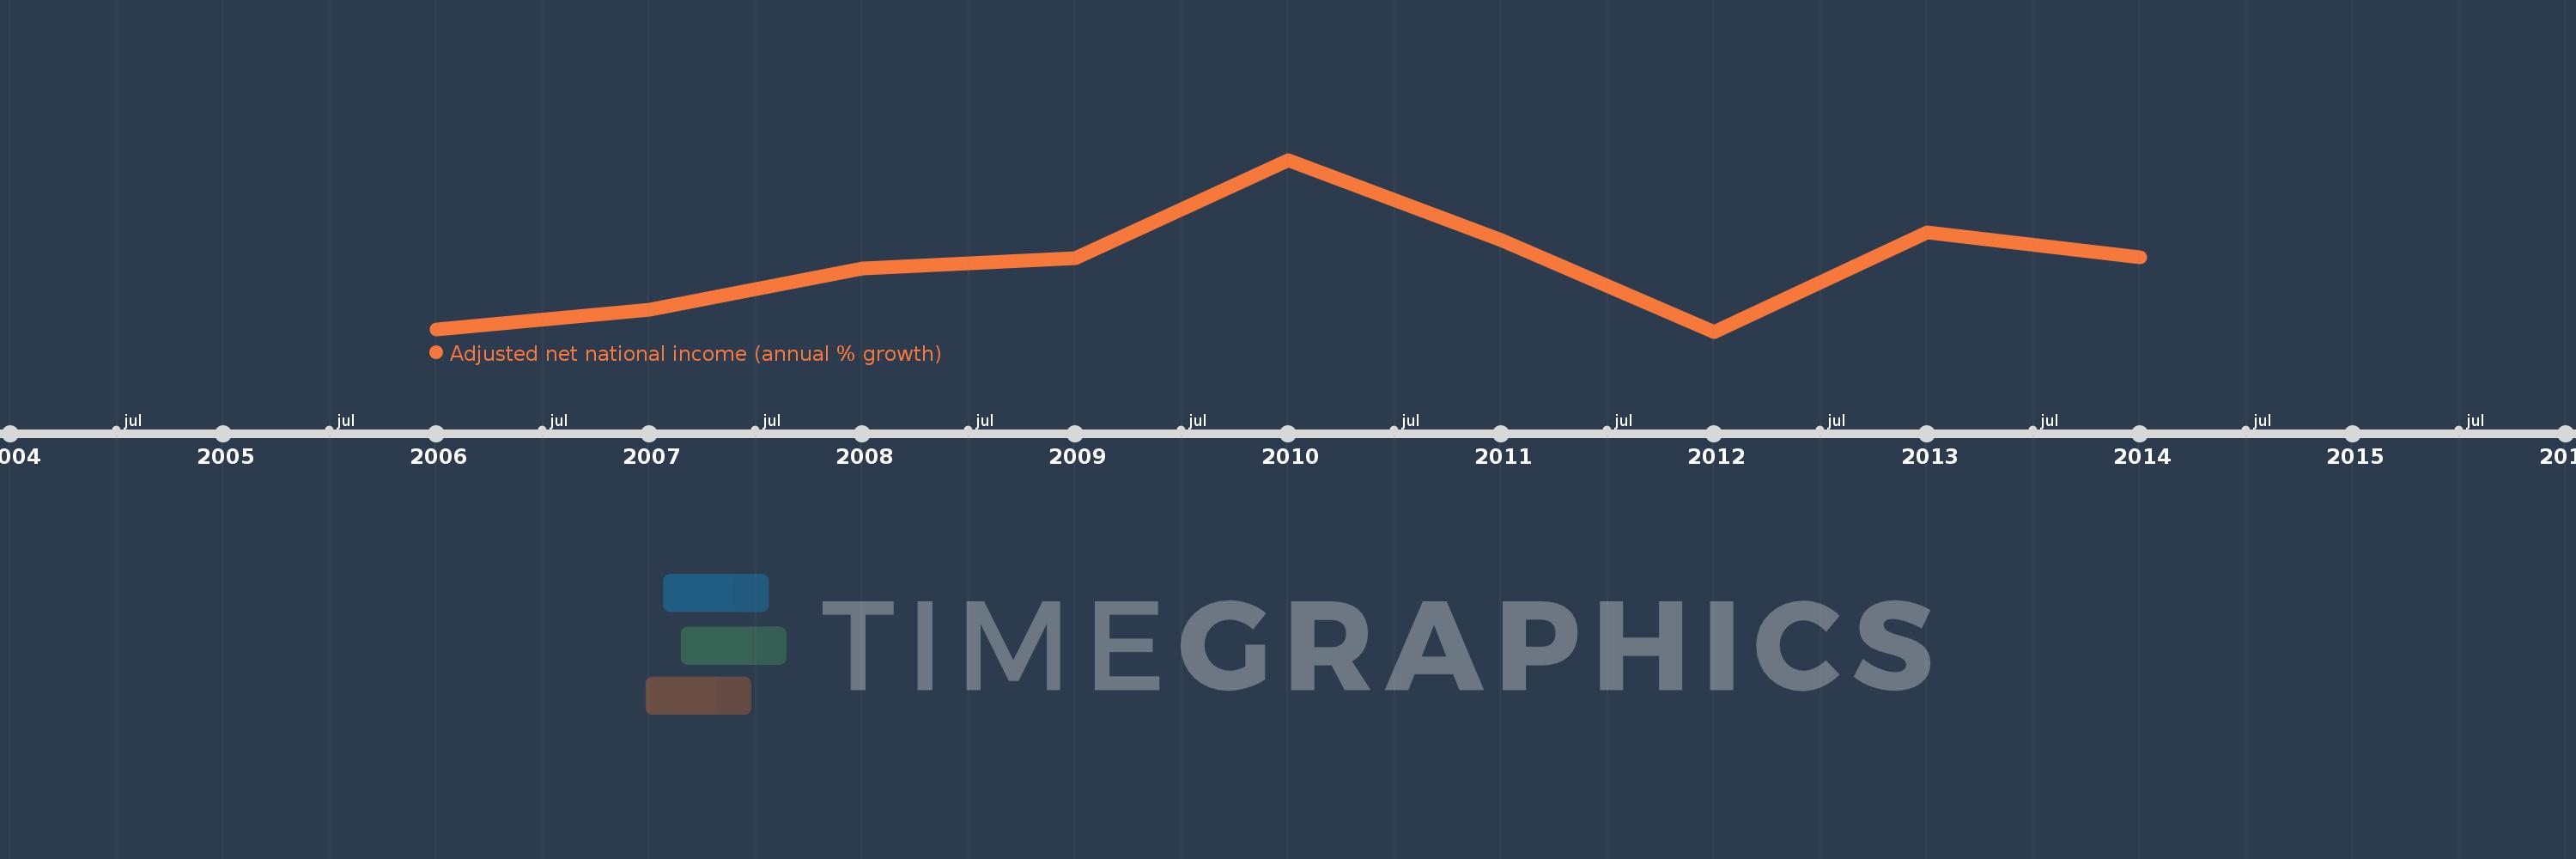
This timeline shows a graph from 2006 to 2014 of Tajikistan. No data until 2005. Number of actual observations by date: 9.
Source name:
World Development Indicators
Source organization:
World Bank staff estimates based on sources and methods in World Bank's "The Changing Wealth of Nations: Measuring Sustainable Development in the New Millennium" (2011).
Categories, topics:
Economy & Growth
Last updated:
apr 23, 2017
Indicators value changes by year
Meaning:
6.622
Minimum:
0.327
jan 1, 2012
Maximum:
16.582
jan 1, 2010
At the date of observation
Value
Absolute change
Change from the previous value
jan 1, 2006
0.543
+0.543
0.0%
jan 1, 2007
2.431
+1.889
347.97%
jan 1, 2008
6.336
+3.905
160.61%
jan 1, 2009
7.3
+0.964
15.21%
jan 1, 2010
16.582
+9.282
127.14%
jan 1, 2011
8.985
-7.598
-45.82%
jan 1, 2012
0.327
-8.658
-96.36%
jan 1, 2013
9.702
+9.375
2.87K%
jan 1, 2014
7.389
-2.312
-23.84%
Ranking of countries by current statistics by years