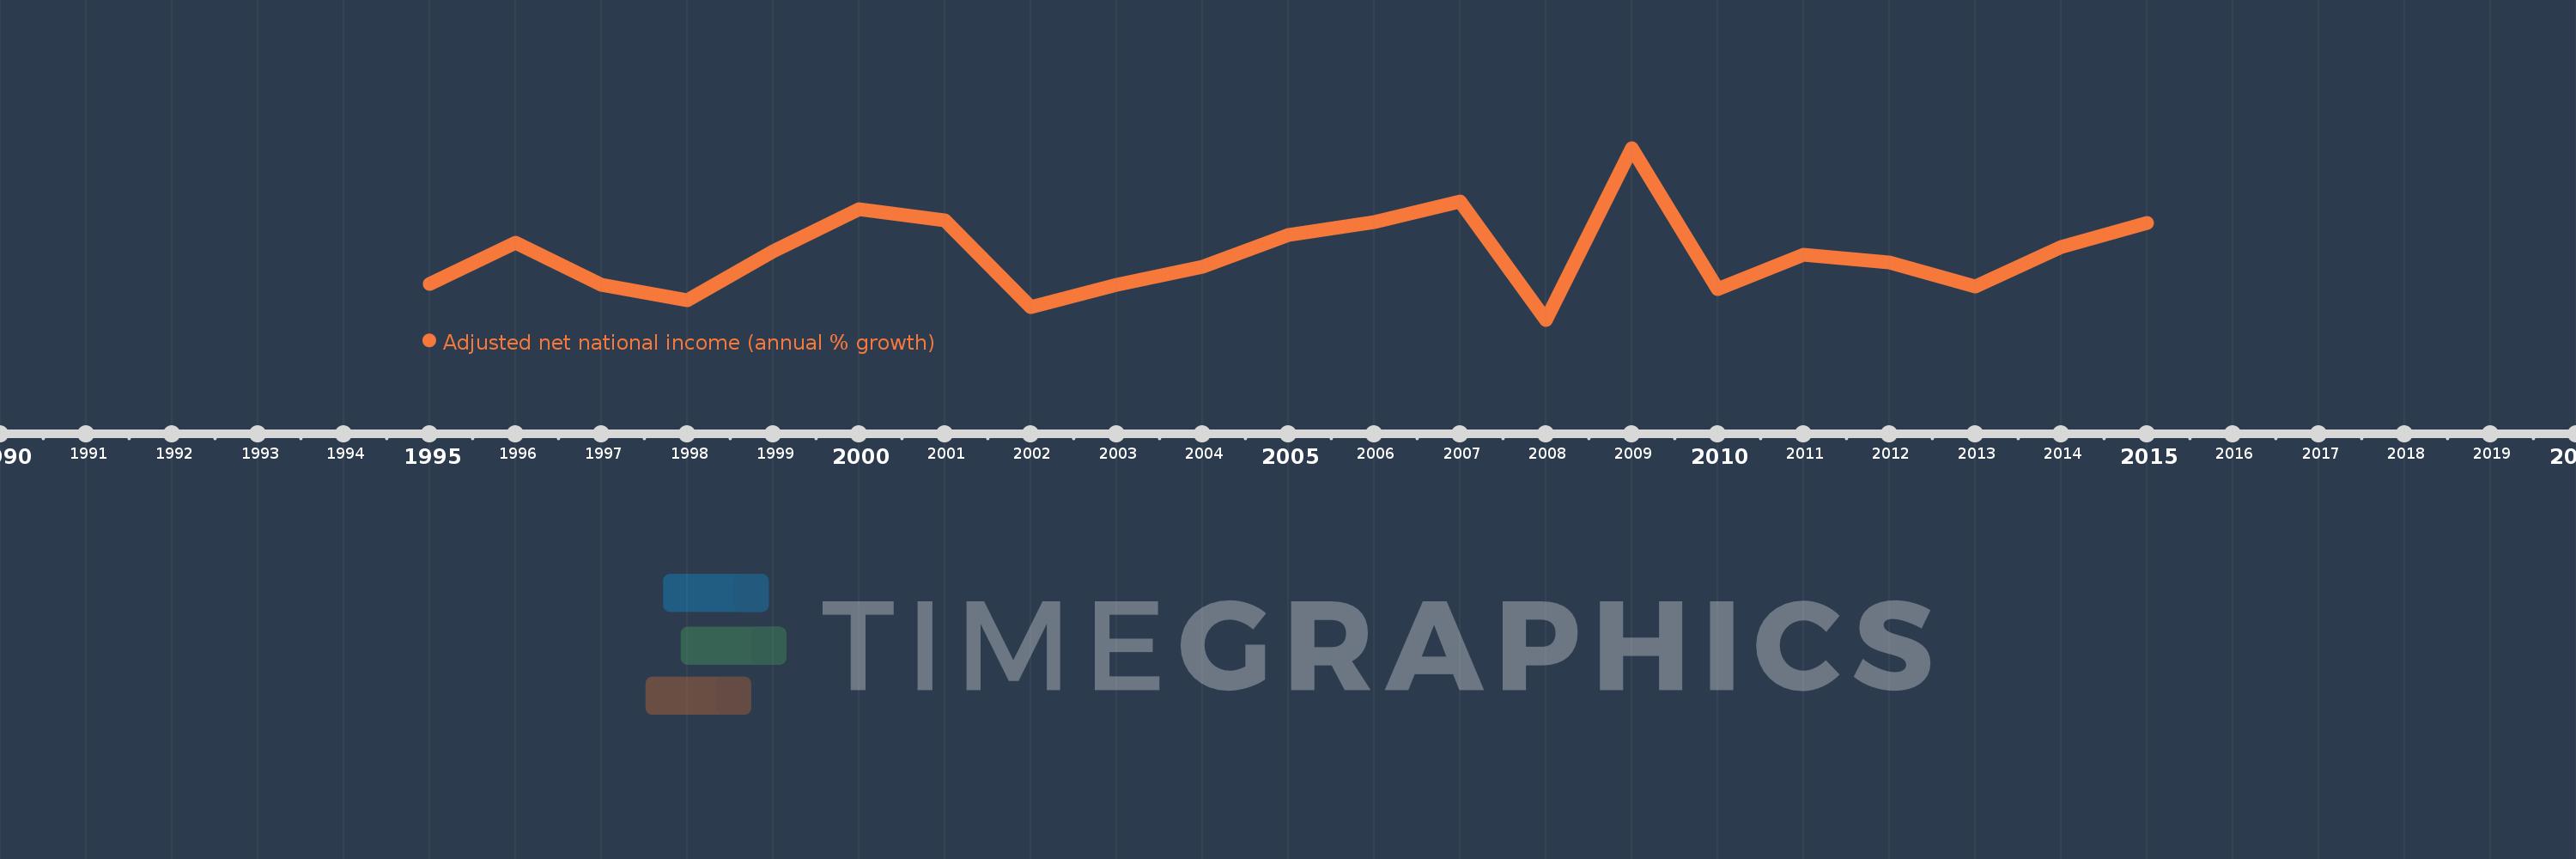
This timeline shows a graph from 1995 to 2015 of Macedonia, FYR. No data until 1994. Number of actual observations by date: 21.
Source name:
World Development Indicators
Source organization:
World Bank staff estimates based on sources and methods in World Bank's "The Changing Wealth of Nations: Measuring Sustainable Development in the New Millennium" (2011).
Categories, topics:
Economy & Growth
Last updated:
apr 23, 2017
Indicators value changes by year
Meaning:
2.706
Minimum:
-2.317
jan 1, 2008
Maximum:
10.872
jan 1, 2009
At the date of observation
Value
Absolute change
Change from the previous value
jan 1, 1995
0.422
+0.422
0.0%
jan 1, 1996
3.577
+3.155
748.01%
jan 1, 1997
0.351
-3.226
-90.2%
jan 1, 1998
-0.846
-1.197
-341.3%
jan 1, 1999
2.909
+3.755
-443.82%
jan 1, 2000
6.192
+3.283
112.83%
jan 1, 2001
5.336
-0.856
-13.82%
jan 1, 2002
-1.372
-6.709
-125.72%
jan 1, 2003
0.38
+1.753
-127.7%
jan 1, 2004
1.769
+1.389
365.31%
jan 1, 2005
4.215
+2.446
138.32%
jan 1, 2006
5.212
+0.997
23.66%
jan 1, 2007
6.772
+1.559
29.92%
jan 1, 2008
-2.317
-9.089
-134.22%
jan 1, 2009
10.872
+13.189
-569.11%
jan 1, 2010
0.006
-10.866
-99.95%
jan 1, 2011
2.679
+2.674
48.01K%
jan 1, 2012
2.082
-0.597
-22.28%
jan 1, 2013
0.257
-1.825
-87.66%
jan 1, 2014
3.236
+2.98
1.16K%
jan 1, 2015
5.091
+1.854
57.3%
Ranking of countries by current statistics by years