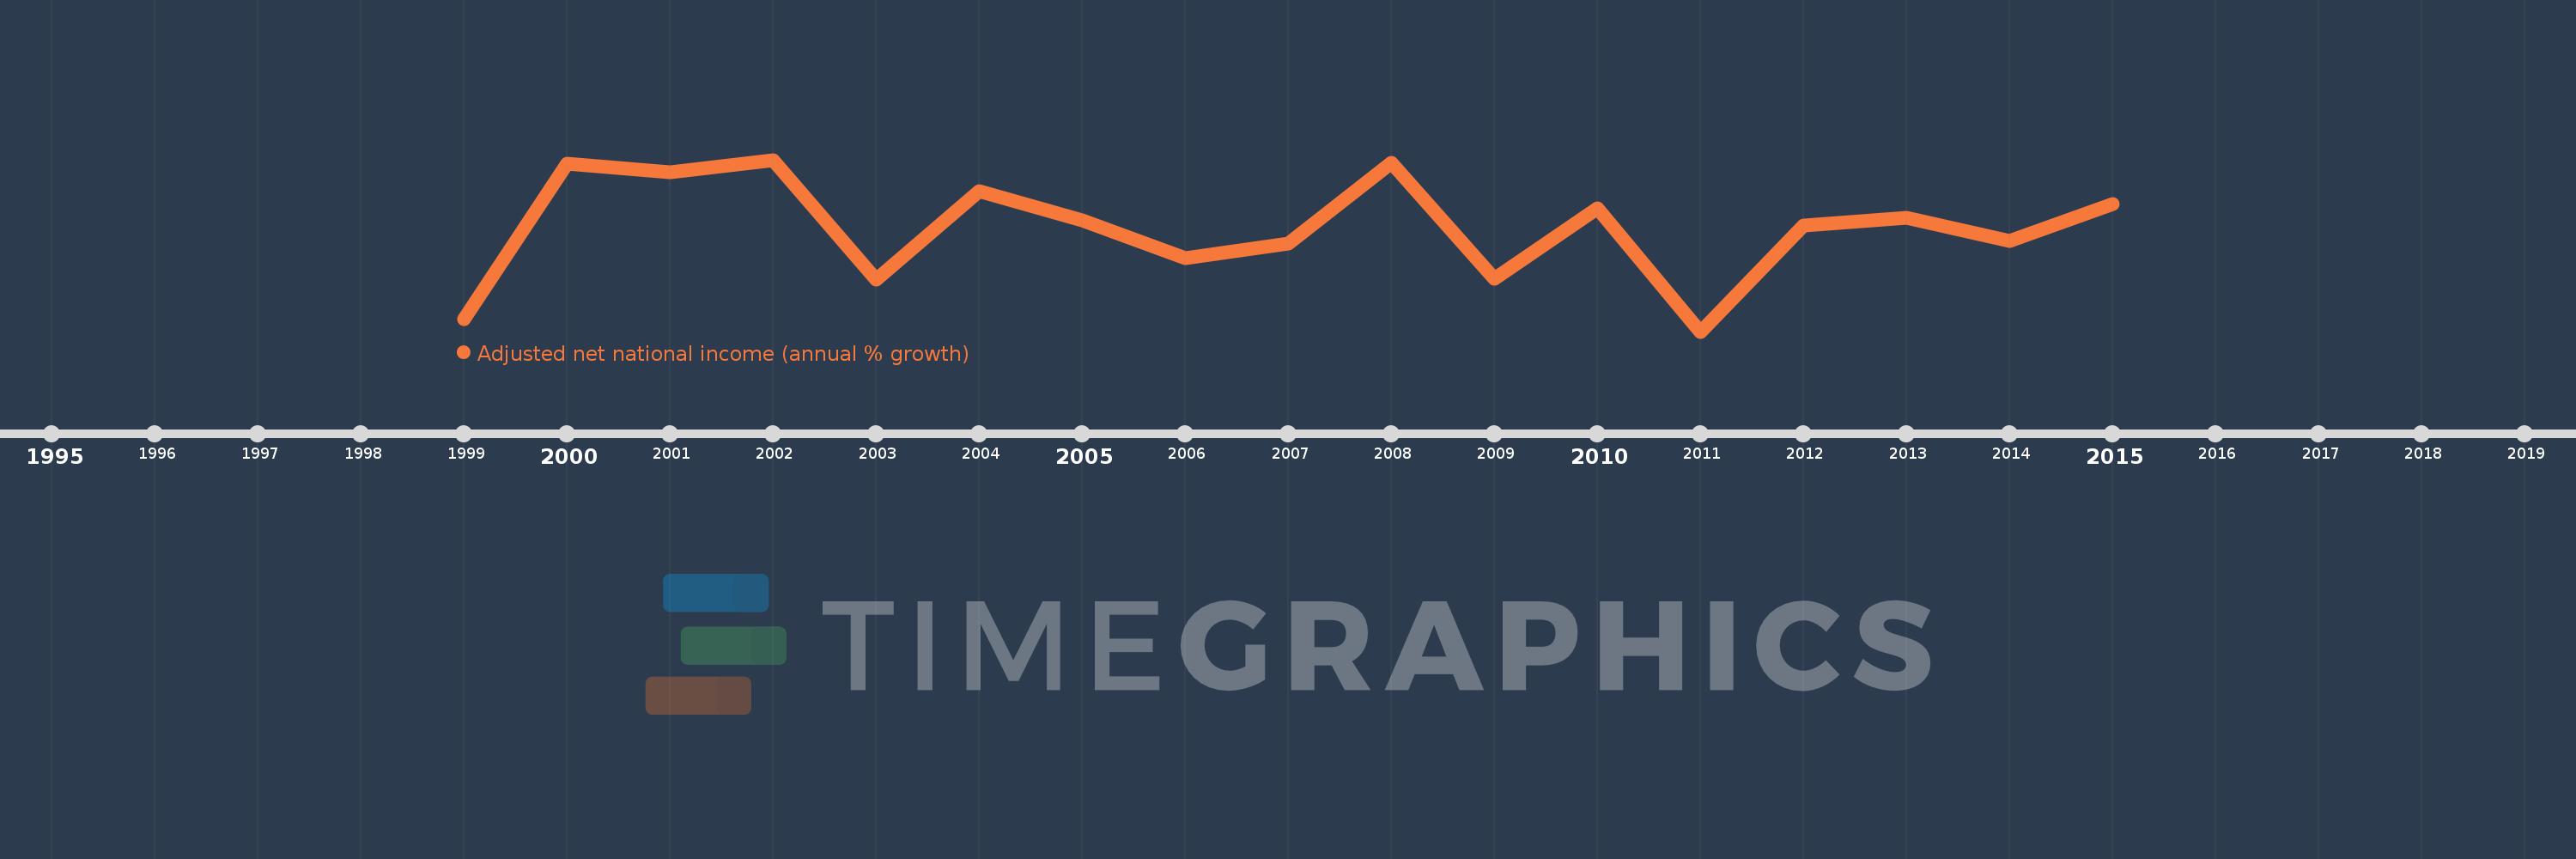
This timeline shows a graph from 1999 to 2015 of Kyrgyz Republic. No data until 1998. Number of actual observations by date: 17.
Source name:
World Development Indicators
Source organization:
World Bank staff estimates based on sources and methods in World Bank's "The Changing Wealth of Nations: Measuring Sustainable Development in the New Millennium" (2011).
Categories, topics:
Economy & Growth
Last updated:
apr 23, 2017
Indicators value changes by year
Meaning:
3.105
Minimum:
-11.032
jan 1, 2011
Maximum:
12.411
jan 1, 2002
At the date of observation
Value
Absolute change
Change from the previous value
jan 1, 1999
-9.329
-9.329
0.0%
jan 1, 2000
11.861
+21.19
-227.14%
jan 1, 2001
10.724
-1.137
-9.58%
jan 1, 2002
12.411
+1.687
15.73%
jan 1, 2003
-3.882
-16.294
-131.28%
jan 1, 2004
8.169
+12.051
-310.41%
jan 1, 2005
4.112
-4.056
-49.66%
jan 1, 2006
-0.975
-5.087
-123.7%
jan 1, 2007
0.936
+1.911
-196.06%
jan 1, 2008
12.044
+11.108
1.19K%
jan 1, 2009
-3.844
-15.888
-131.91%
jan 1, 2010
5.793
+9.636
-250.72%
jan 1, 2011
-11.032
-16.824
-290.43%
jan 1, 2012
3.472
+14.504
-131.48%
jan 1, 2013
4.52
+1.047
30.17%
jan 1, 2014
1.383
-3.137
-69.4%
jan 1, 2015
6.417
+5.034
364.04%
Ranking of countries by current statistics by years