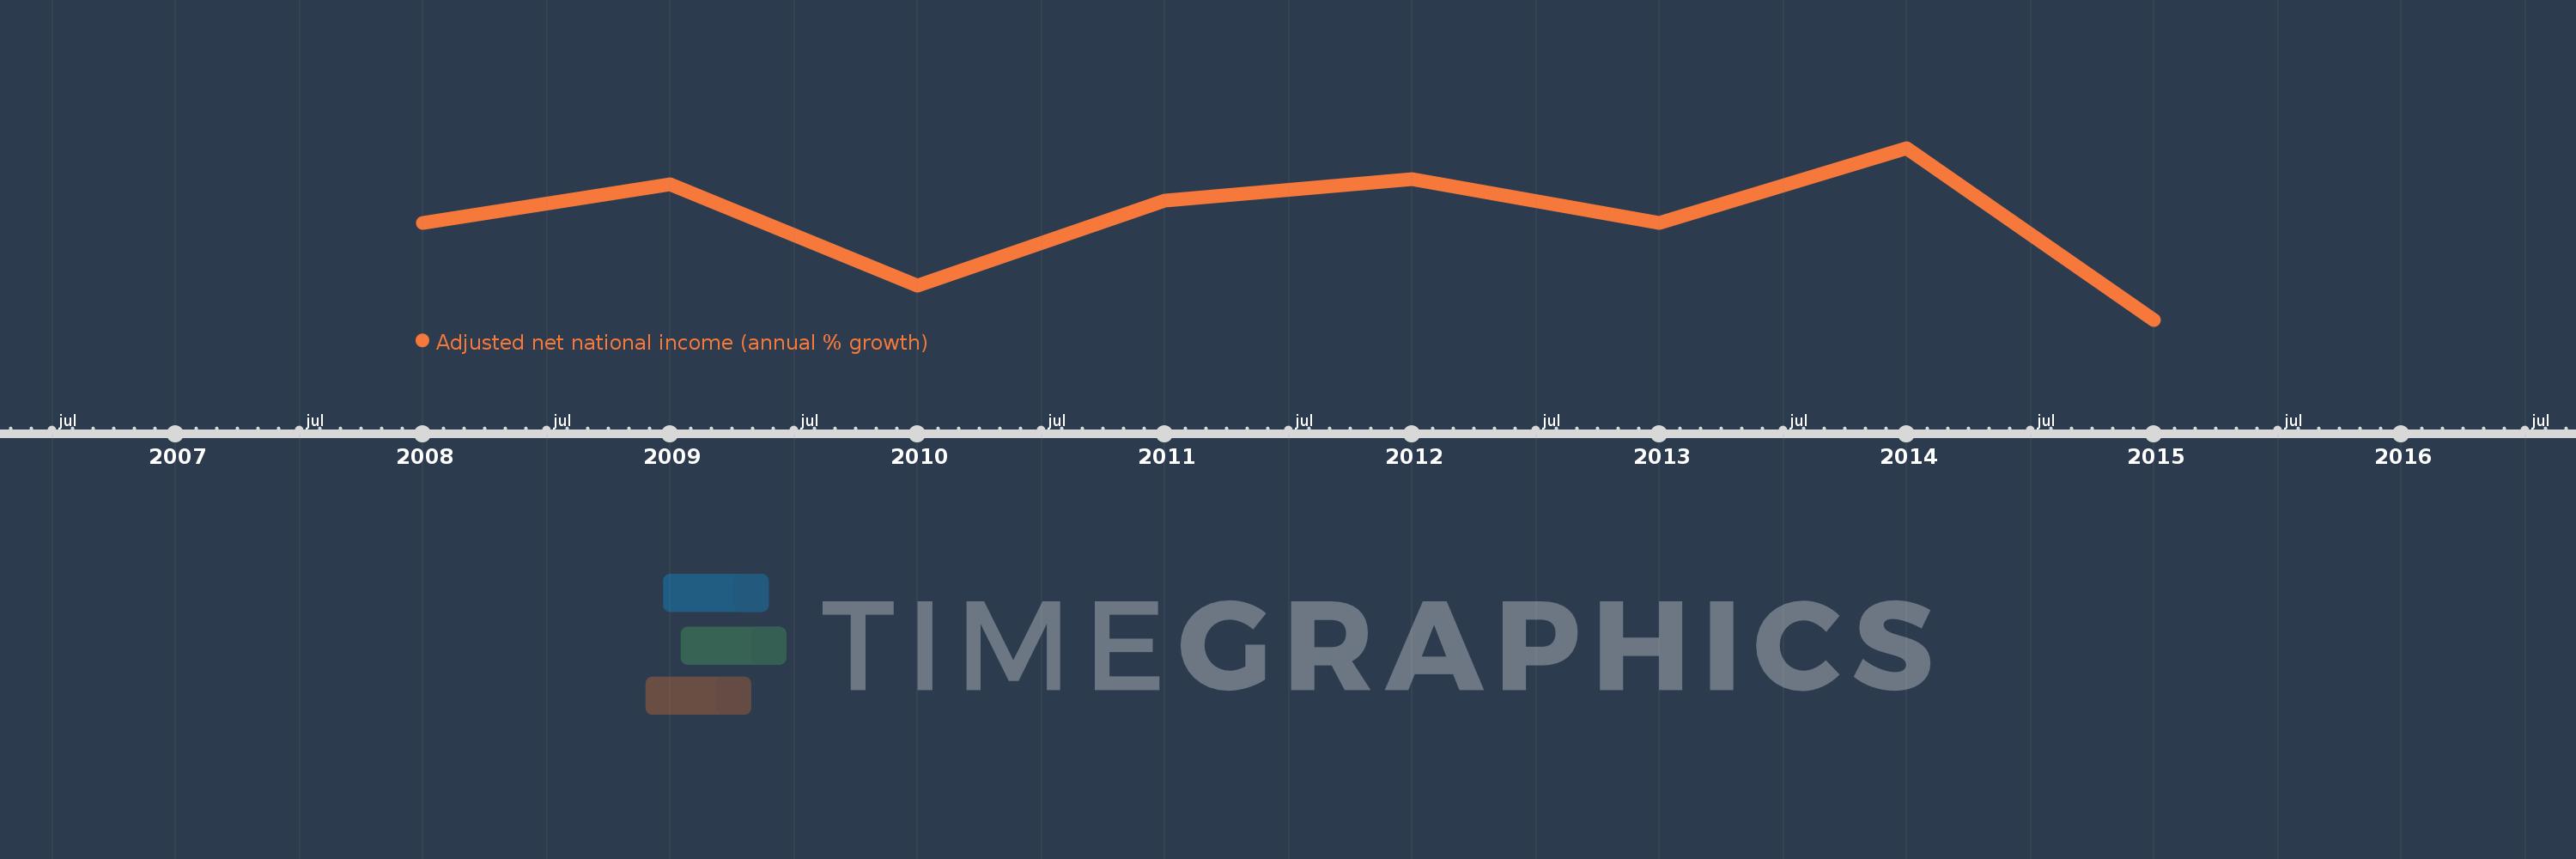
This timeline shows a graph from 2008 to 2015 of Ghana. No data until 2007. Number of actual observations by date: 8.
Source name:
World Development Indicators
Source organization:
World Bank staff estimates based on sources and methods in World Bank's "The Changing Wealth of Nations: Measuring Sustainable Development in the New Millennium" (2011).
Categories, topics:
Economy & Growth
Last updated:
apr 23, 2017
Indicators value changes by year
Meaning:
5.678
Minimum:
-5.028
jan 1, 2015
Maximum:
13.5
jan 1, 2014
At the date of observation
Value
Absolute change
Change from the previous value
jan 1, 2008
5.388
+5.388
0.0%
jan 1, 2009
9.563
+4.175
77.49%
jan 1, 2010
-1.359
-10.922
-114.21%
jan 1, 2011
7.813
+9.173
-674.79%
jan 1, 2012
10.18
+2.367
30.29%
jan 1, 2013
5.369
-4.811
-47.26%
jan 1, 2014
13.5
+8.131
151.46%
jan 1, 2015
-5.028
-18.528
-137.24%
Ranking of countries by current statistics by years