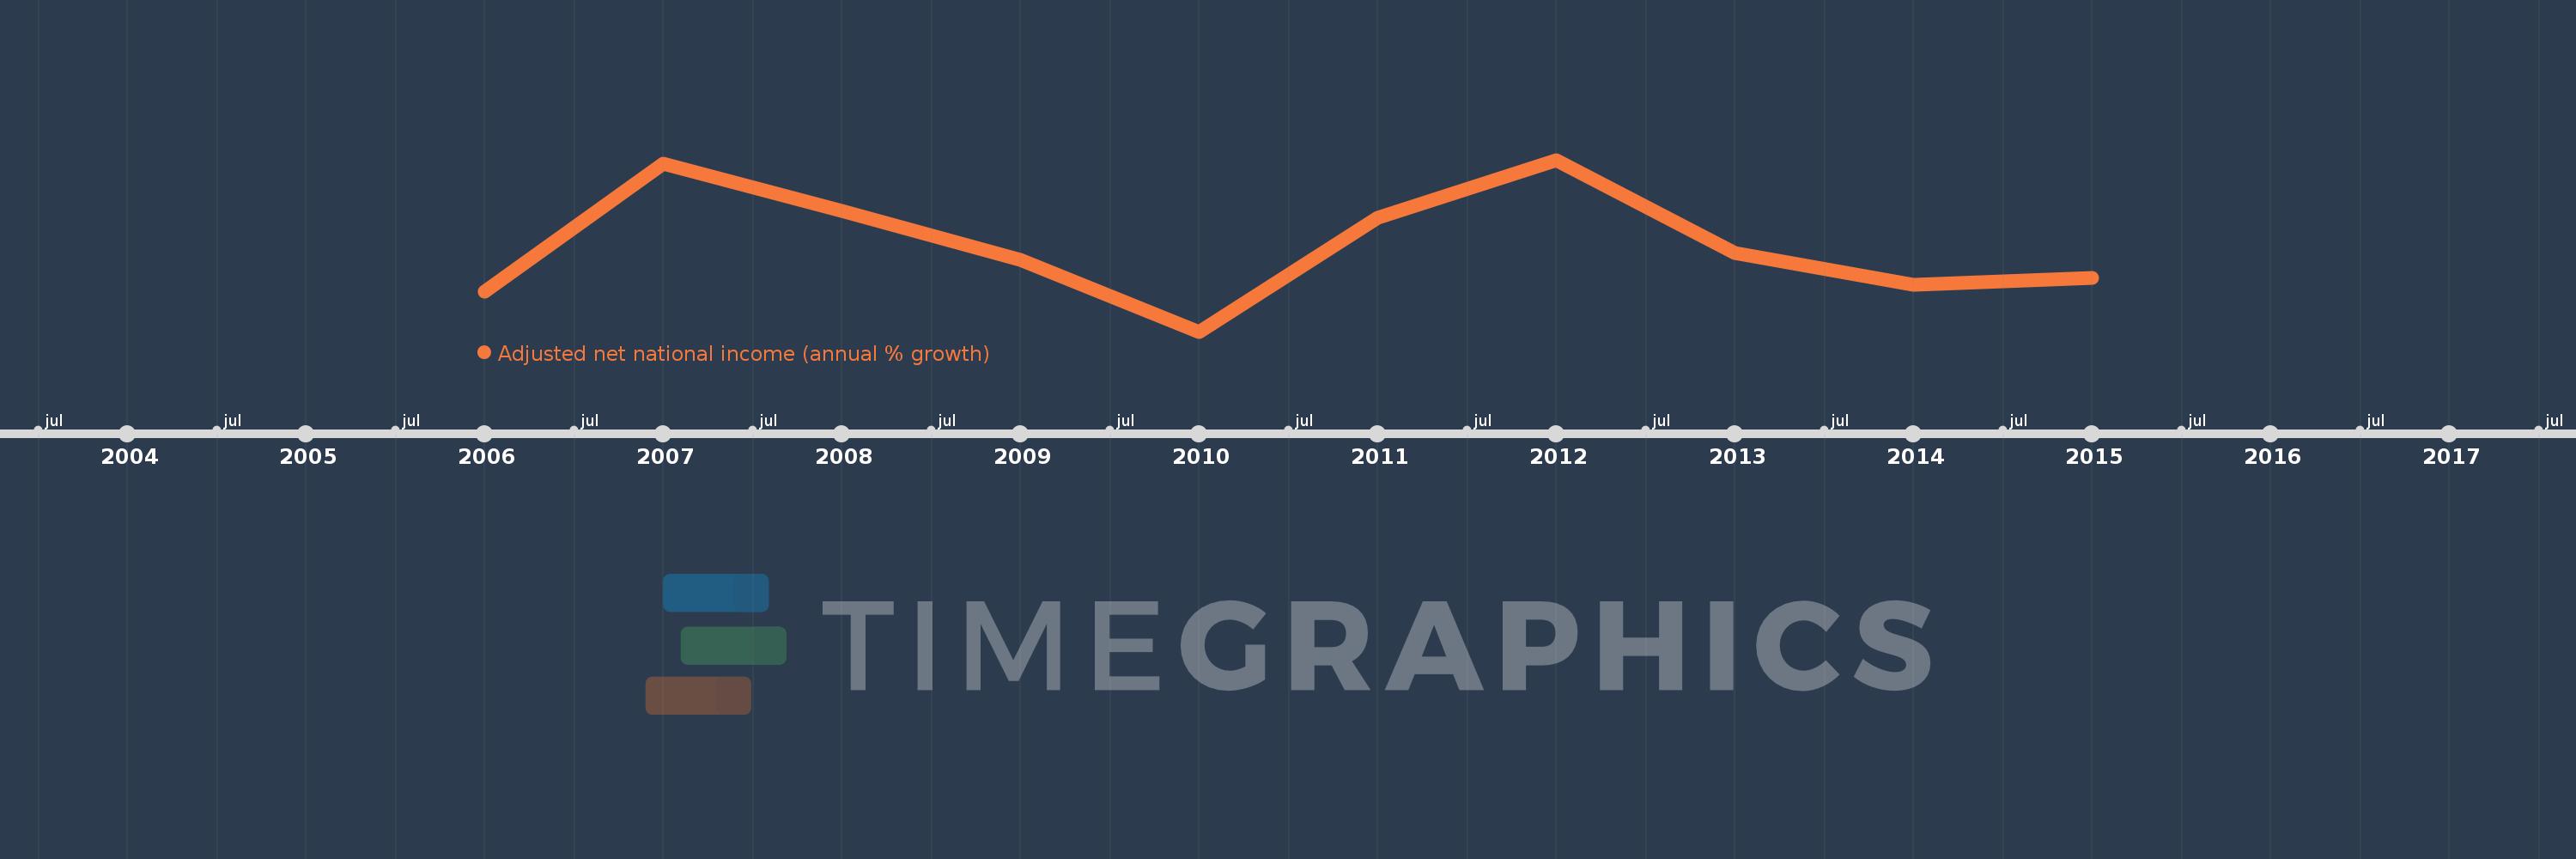
This timeline shows a graph from 2006 to 2015 of Other small states. No data until 2005. Number of actual observations by date: 10.
Source name:
World Development Indicators
Source organization:
World Bank staff estimates based on sources and methods in World Bank's "The Changing Wealth of Nations: Measuring Sustainable Development in the New Millennium" (2011).
Categories, topics:
Economy & Growth
Last updated:
apr 23, 2017
Indicators value changes by year
Meaning:
9.142
Minimum:
-1.725
jan 1, 2010
Maximum:
19.85
jan 1, 2012
At the date of observation
Value
Absolute change
Change from the previous value
jan 1, 2006
3.315
+3.315
0.0%
jan 1, 2007
19.344
+16.028
483.45%
jan 1, 2008
13.46
-5.884
-30.42%
jan 1, 2009
7.314
-6.146
-45.66%
jan 1, 2010
-1.725
-9.039
-123.59%
jan 1, 2011
12.561
+14.286
-828.08%
jan 1, 2012
19.85
+7.289
58.03%
jan 1, 2013
8.158
-11.691
-58.9%
jan 1, 2014
4.181
-3.977
-48.75%
jan 1, 2015
4.967
+0.786
18.81%
Ranking of countries by current statistics by years