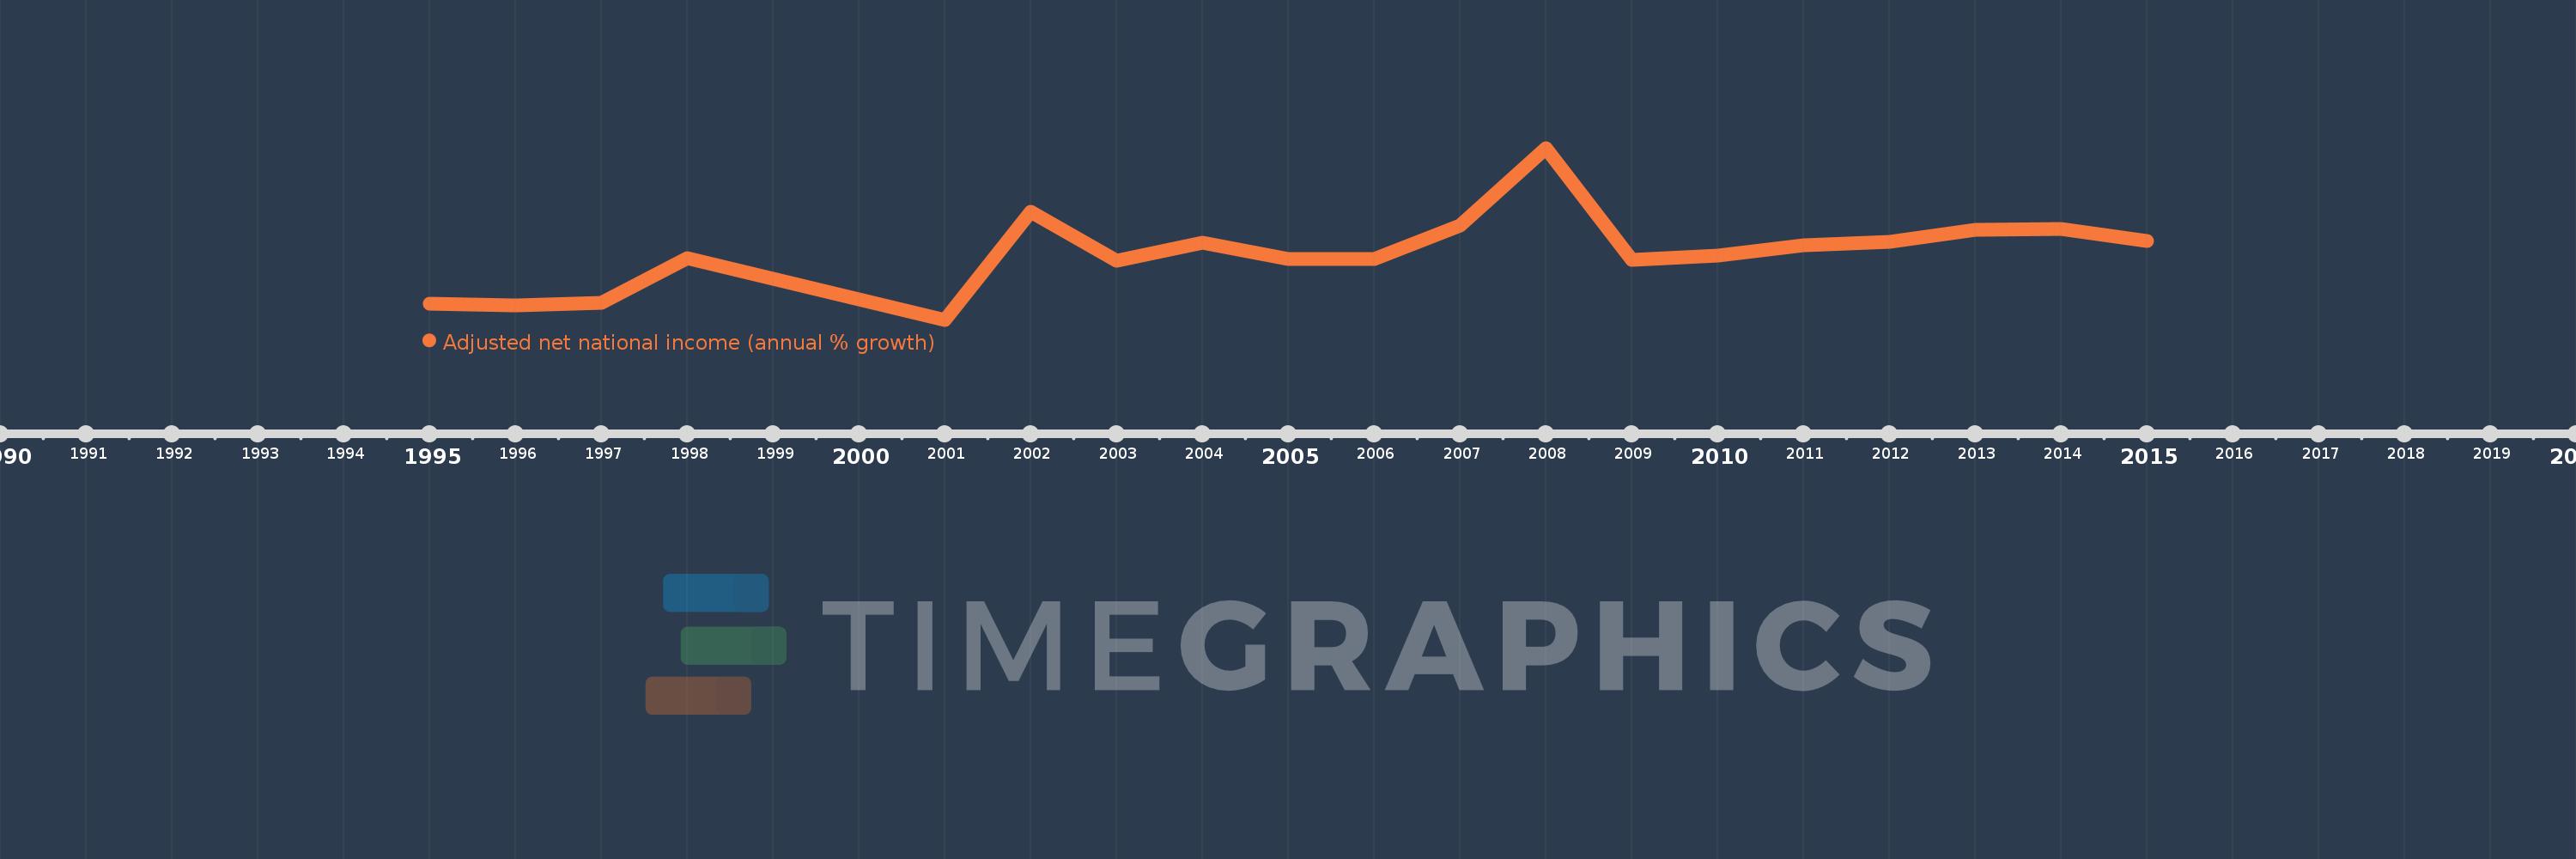
This timeline shows a graph from 1995 to 2015 of Kazakhstan. No data until 1994. Number of actual observations by date: 19.
Source name:
World Development Indicators
Source organization:
World Bank staff estimates based on sources and methods in World Bank's "The Changing Wealth of Nations: Measuring Sustainable Development in the New Millennium" (2011).
Categories, topics:
Economy & Growth
Last updated:
apr 23, 2017
Indicators value changes by year
Meaning:
5.55
Minimum:
-17.543
jan 1, 2001
Maximum:
41.537
jan 1, 2008
At the date of observation
Value
Absolute change
Change from the previous value
jan 1, 1995
-11.897
-11.897
0.0%
jan 1, 1996
-12.469
-0.572
4.81%
jan 1, 1997
-11.792
+0.677
-5.43%
jan 1, 1998
3.663
+15.455
-131.06%
jan 1, 2001
-17.543
-21.206
-578.94%
jan 1, 2002
19.472
+37.015
-210.99%
jan 1, 2003
2.681
-16.791
-86.23%
jan 1, 2004
8.864
+6.183
230.64%
jan 1, 2005
3.246
-5.618
-63.38%
jan 1, 2006
3.289
+0.043
1.32%
jan 1, 2007
14.895
+11.606
352.84%
jan 1, 2008
41.537
+26.642
178.87%
jan 1, 2009
3.02
-38.517
-92.73%
jan 1, 2010
4.515
+1.495
49.49%
jan 1, 2011
8.086
+3.572
79.12%
jan 1, 2012
9.382
+1.296
16.03%
jan 1, 2013
13.399
+4.017
42.81%
jan 1, 2014
13.67
+0.271
2.02%
jan 1, 2015
9.427
-4.243
-31.04%
Ranking of countries by current statistics by years