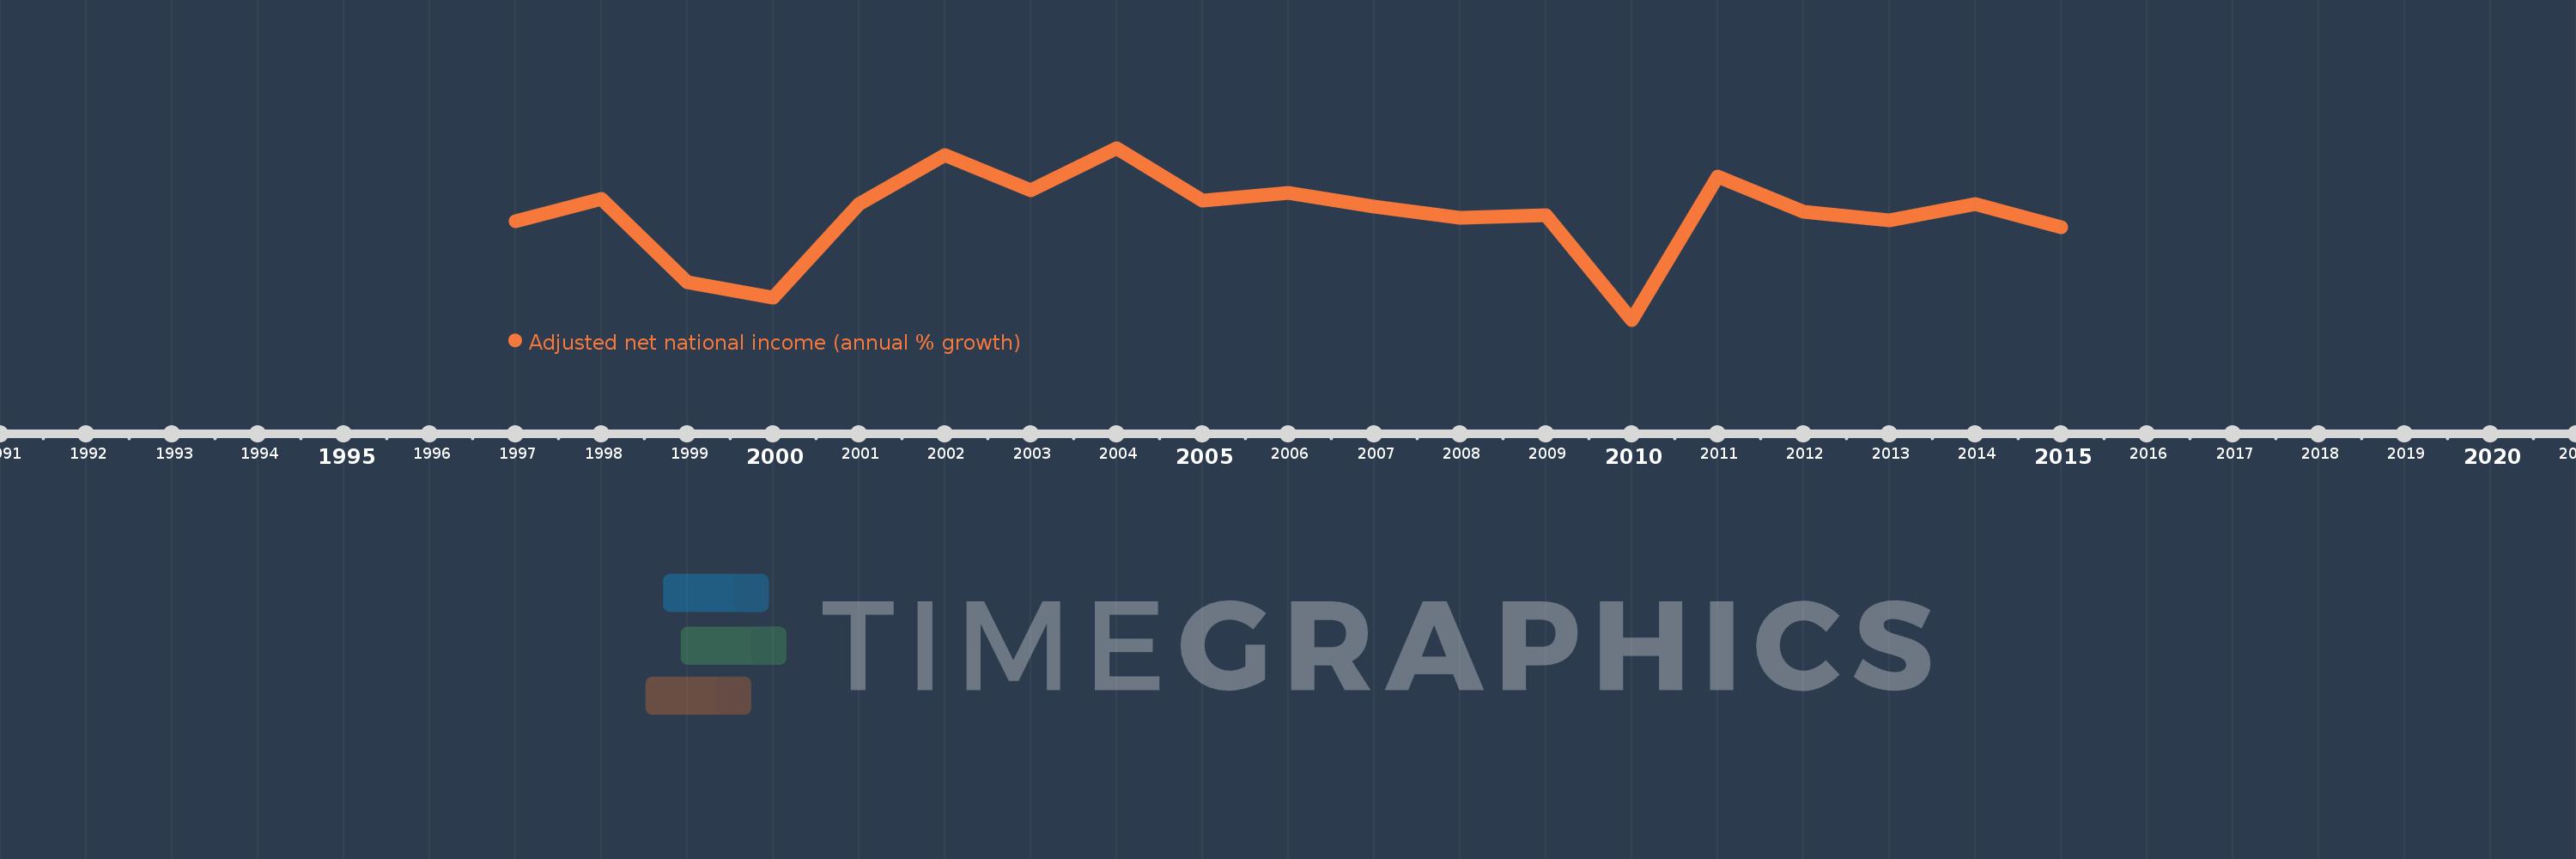
This timeline shows a graph from 1997 to 2015 of Moldova. No data until 1996. Number of actual observations by date: 19.
Source name:
World Development Indicators
Source organization:
World Bank staff estimates based on sources and methods in World Bank's "The Changing Wealth of Nations: Measuring Sustainable Development in the New Millennium" (2011).
Categories, topics:
Economy & Growth
Last updated:
apr 23, 2017
Indicators value changes by year
Meaning:
4.813
Minimum:
-12.692
jan 1, 2010
Maximum:
16.075
jan 1, 2004
At the date of observation
Value
Absolute change
Change from the previous value
jan 1, 1997
3.803
+3.803
0.0%
jan 1, 1998
7.499
+3.696
97.18%
jan 1, 1999
-6.421
-13.919
-185.62%
jan 1, 2000
-8.936
-2.515
39.18%
jan 1, 2001
6.646
+15.582
-174.37%
jan 1, 2002
14.933
+8.287
124.7%
jan 1, 2003
9.029
-5.904
-39.53%
jan 1, 2004
16.075
+7.046
78.04%
jan 1, 2005
7.295
-8.78
-54.62%
jan 1, 2006
8.578
+1.283
17.58%
jan 1, 2007
6.237
-2.34
-27.28%
jan 1, 2008
4.378
-1.86
-29.82%
jan 1, 2009
4.812
+0.434
9.92%
jan 1, 2010
-12.692
-17.504
-363.77%
jan 1, 2011
11.285
+23.977
-188.92%
jan 1, 2012
5.411
-5.874
-52.05%
jan 1, 2013
3.892
-1.519
-28.08%
jan 1, 2014
6.75
+2.858
73.43%
jan 1, 2015
2.867
-3.883
-57.53%
Ranking of countries by current statistics by years