29
/
en
AIzaSyAYiBZKx7MnpbEhh9jyipgxe19OcubqV5w
April 1, 2024
96576
Burundi
BDI
true
2
1
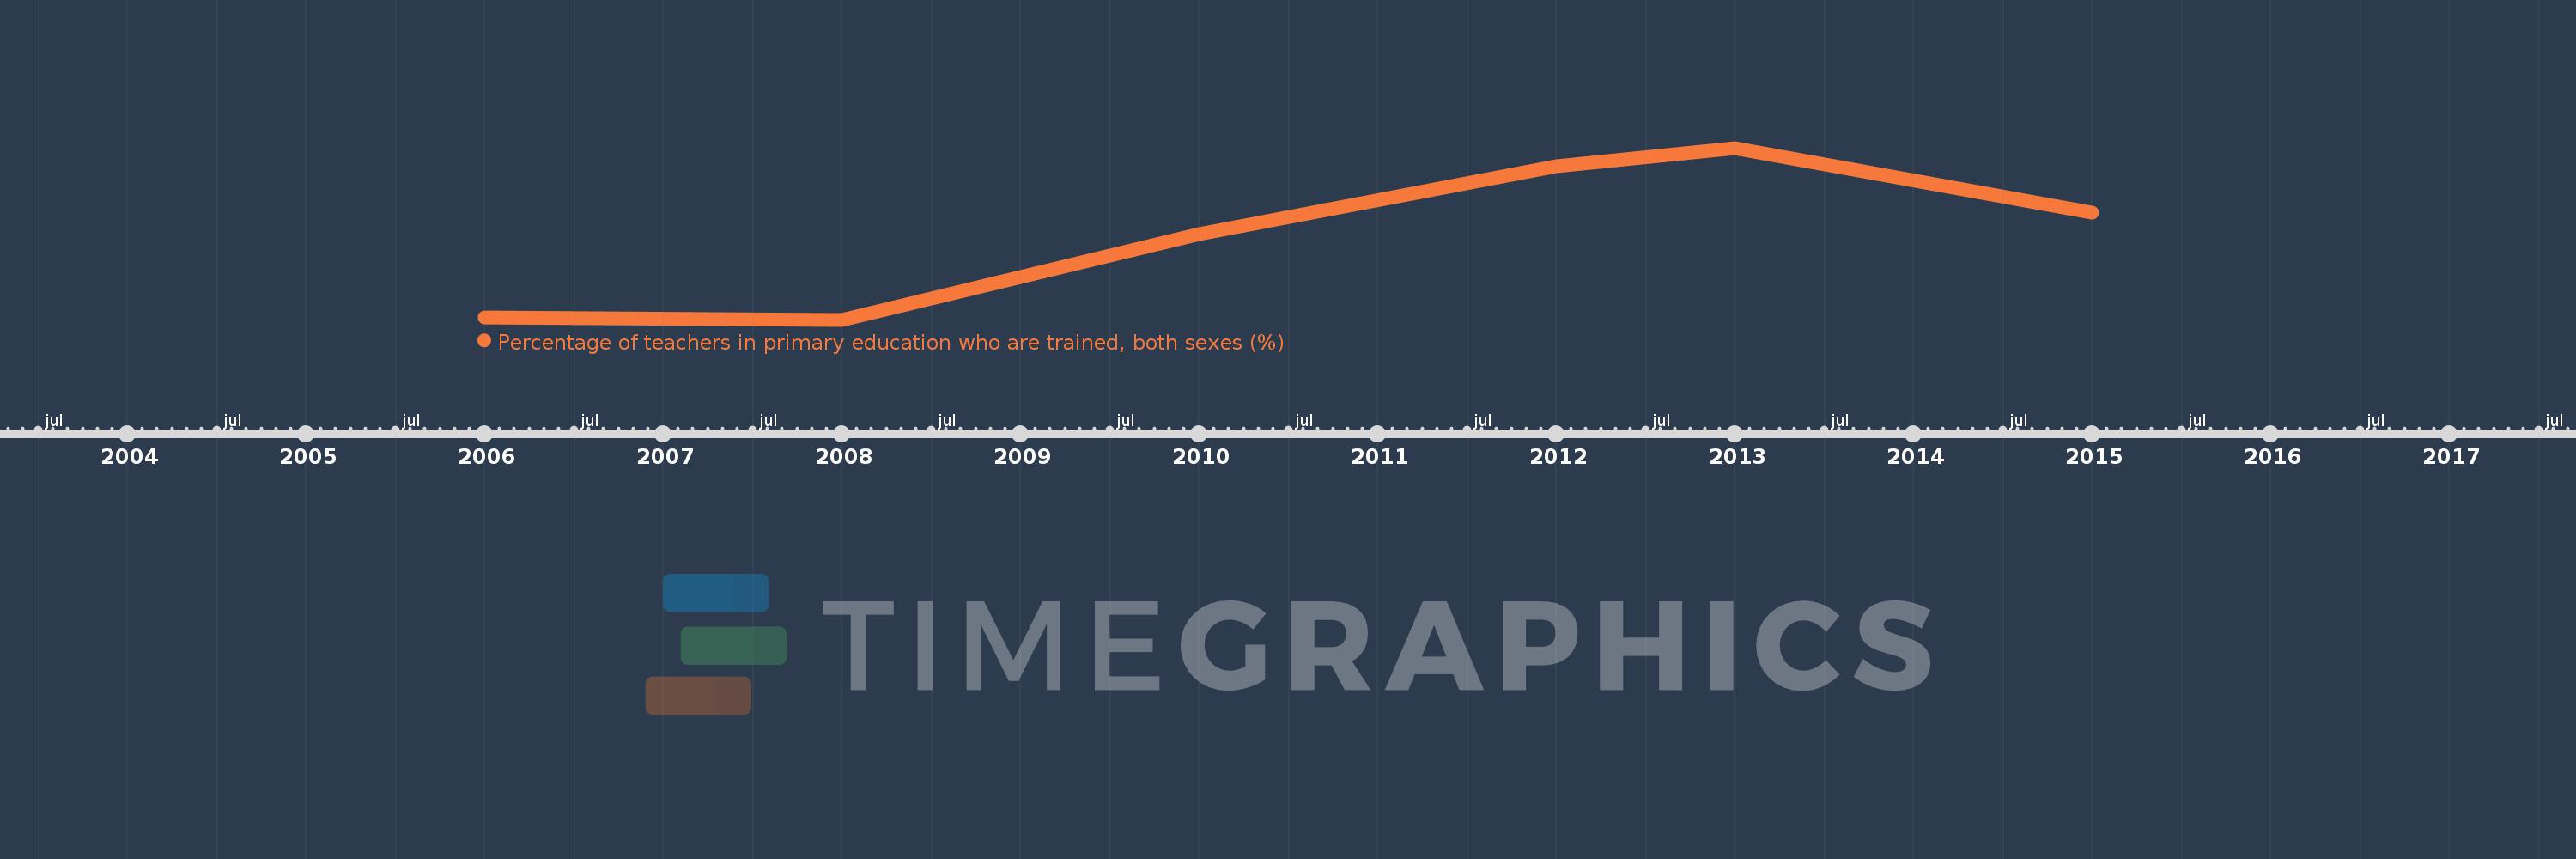
Percentage of teachers in primary education who are trained, both sexes (%)
2015,2013,2012,2010,2008,2006
This statistics in other country:
Timeline:
This timeline shows a graph from 2006 to 2015 of Burundi. No data until 2005. Number of actual observations by date: 6.
Source name:
World Development Indicators
Source organization:
United Nations Educational, Scientific, and Cultural Organization (UNESCO) Institute for Statistics.
Categories, topics:
Education
Last updated:
apr 23, 2017
Indicators value changes by year
Minimum:
87.416
jan 1, 2008
Maximum:
94.987
jan 1, 2013
At the date of observation
Value
Absolute change
Change from previous value
jan 1, 2006
87.51
+87.51
0.0%
jan 1, 2008
87.416
-0.094
-0.11%
jan 1, 2010
91.189
+3.773
4.32%
jan 1, 2012
94.182
+2.993
3.28%
jan 1, 2013
94.987
+0.805
0.86%
jan 1, 2015
92.151
-2.836
-2.99%
Ranking of countries by current statistics by years


Comments: