29
/
en
AIzaSyAYiBZKx7MnpbEhh9jyipgxe19OcubqV5w
April 1, 2024
76550
Bahamas, The
BHS
true
2
1
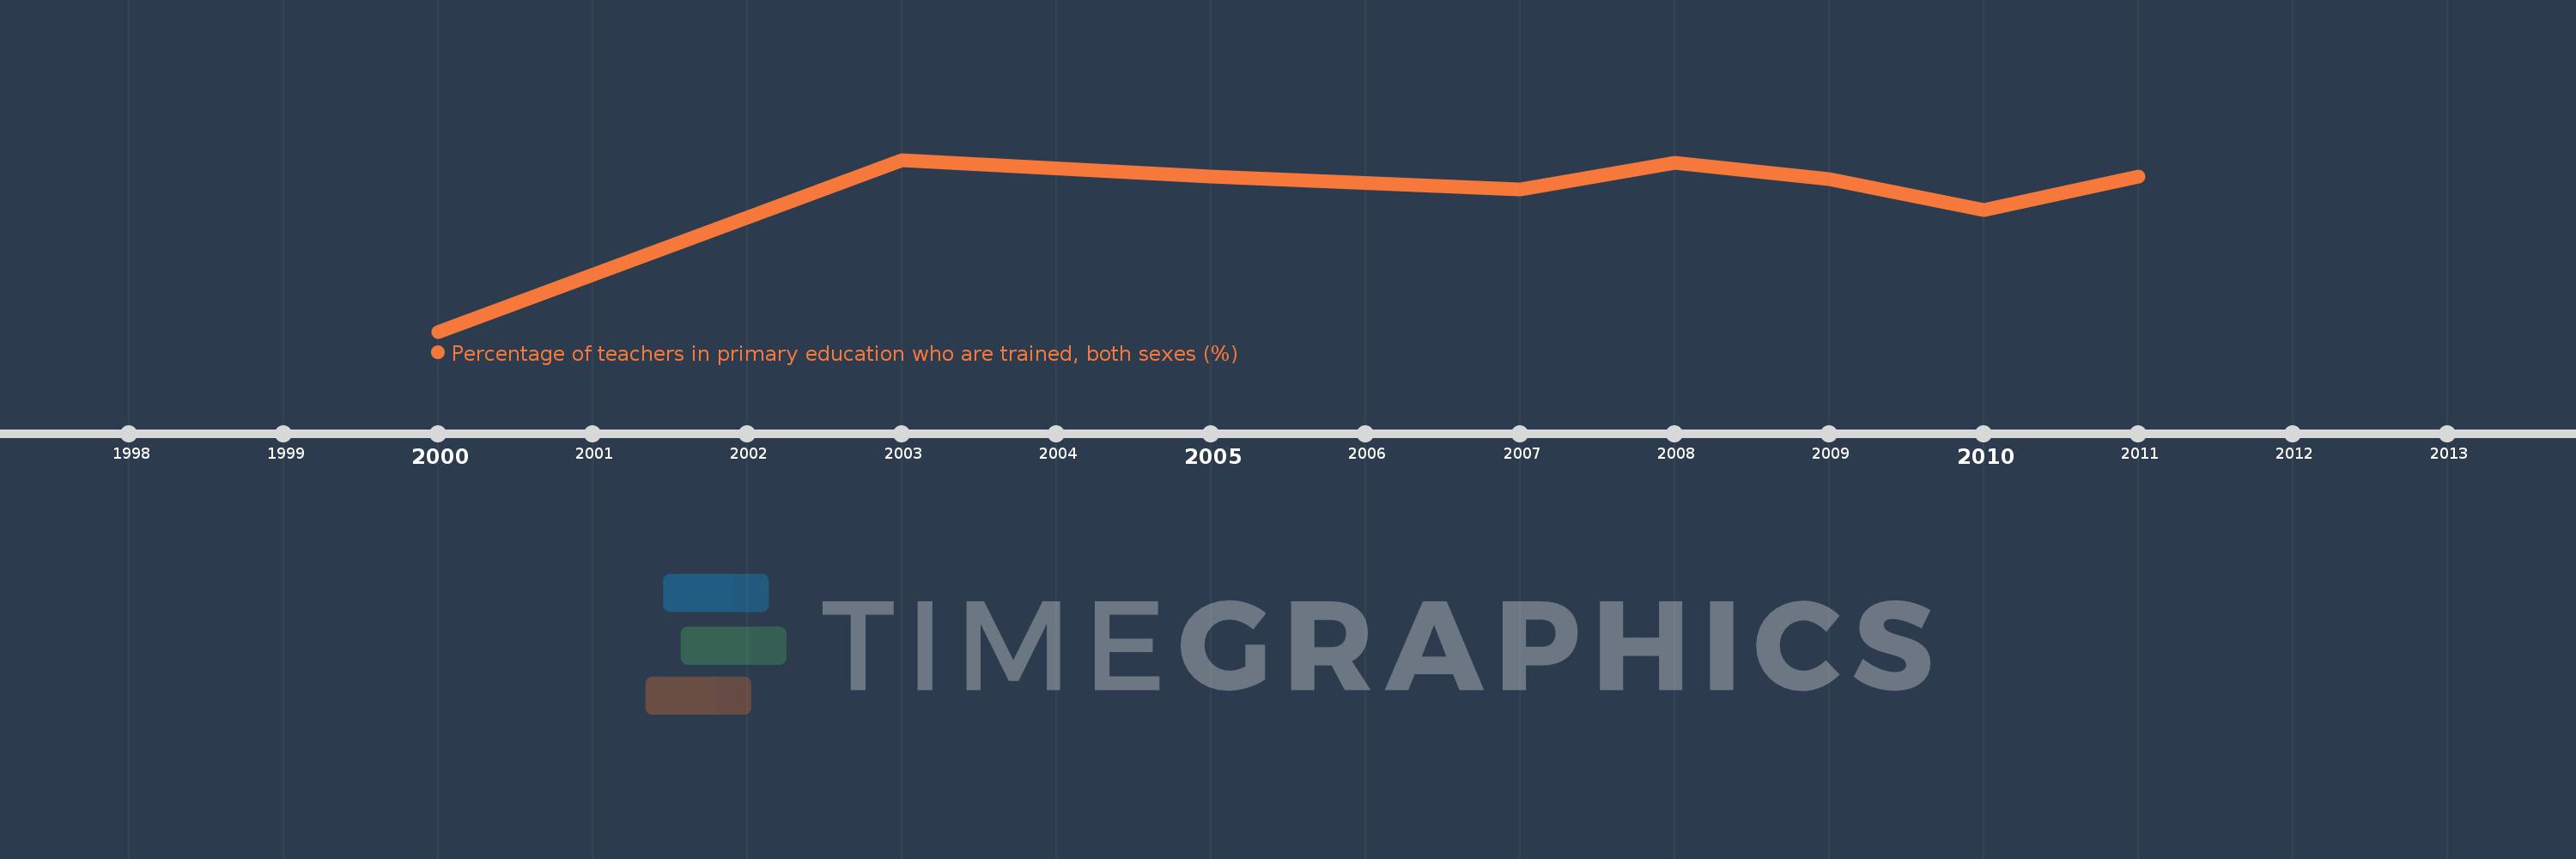
Percentage of teachers in primary education who are trained, both sexes (%)
2011,2010,2009,2008,2007,2005,2003,2000
This statistics in other country:
Timeline:
This timeline shows a graph from 2000 to 2011 of Bahamas, The. No data until 1999. Number of actual observations by date: 8.
Source name:
World Development Indicators
Source organization:
United Nations Educational, Scientific, and Cultural Organization (UNESCO) Institute for Statistics.
Categories, topics:
Education
Last updated:
apr 23, 2017
Indicators value changes by year
Minimum:
58.437
jan 1, 2000
Maximum:
95.121
jan 1, 2003
At the date of observation
Value
Absolute change
Change from previous value
jan 1, 2000
58.437
+58.437
0.0%
jan 1, 2003
95.121
+36.684
62.77%
jan 1, 2005
91.535
-3.586
-3.77%
jan 1, 2007
88.822
-2.713
-2.96%
jan 1, 2008
94.463
+5.641
6.35%
jan 1, 2009
91.084
-3.378
-3.58%
jan 1, 2010
84.42
-6.664
-7.32%
jan 1, 2011
91.549
+7.128
8.44%
Ranking of countries by current statistics by years


Comments: