29
/
en
AIzaSyAYiBZKx7MnpbEhh9jyipgxe19OcubqV5w
April 1, 2024
83248
Belize
BLZ
true
2
1
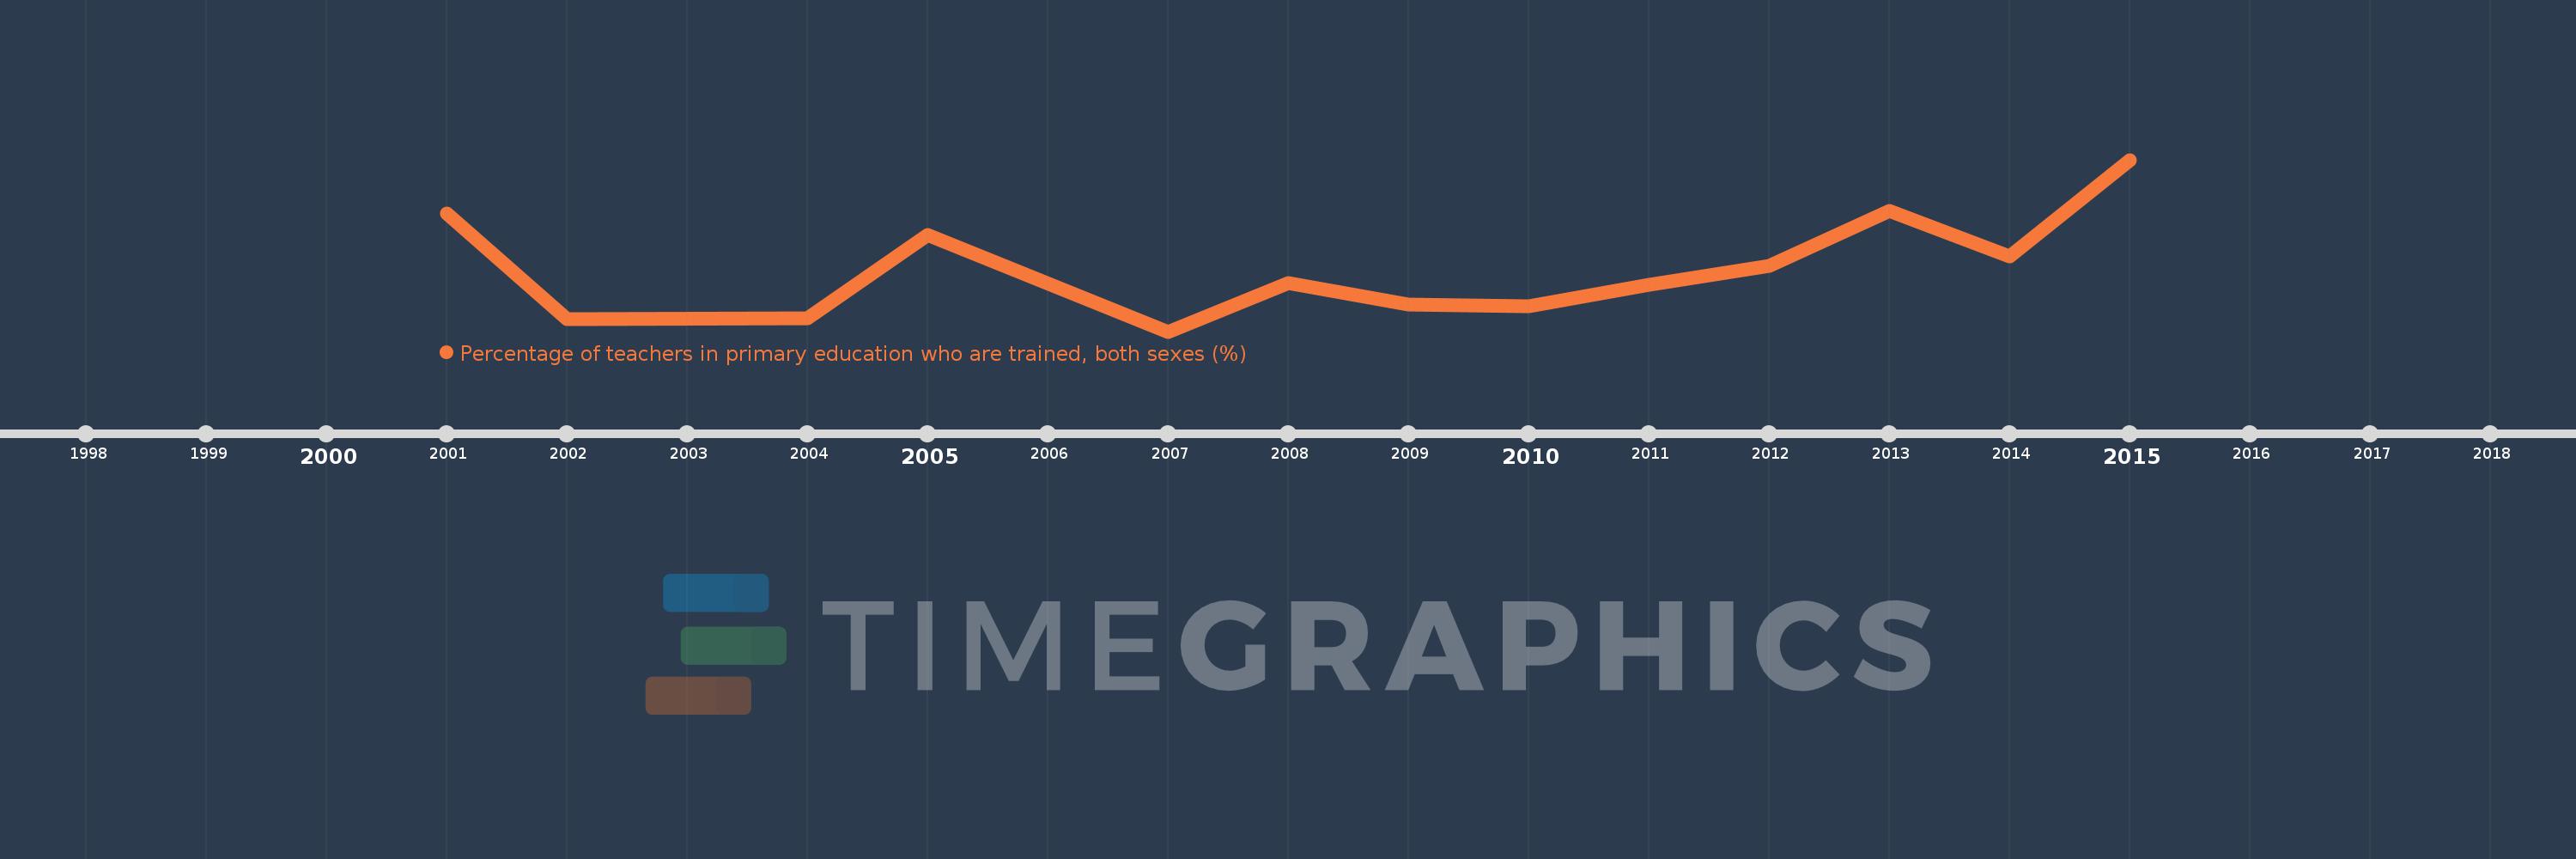
Percentage of teachers in primary education who are trained, both sexes (%)
2015,2014,2013,2012,2011,2010,2009,2008,2007,2005,2004,2002,2001
This statistics in other country:
Timeline:
This timeline shows a graph from 2001 to 2015 of Belize. No data until 2000. Number of actual observations by date: 13.
Source name:
World Development Indicators
Source organization:
United Nations Educational, Scientific, and Cultural Organization (UNESCO) Institute for Statistics.
Categories, topics:
Education
Last updated:
apr 23, 2017
Indicators value changes by year
Minimum:
39.376
jan 1, 2007
At the date of observation
Value
Absolute change
Change from previous value
jan 1, 2001
54.086
+54.086
0.0%
jan 1, 2002
40.898
-13.189
-24.38%
jan 1, 2004
40.985
+0.087
0.21%
jan 1, 2005
51.446
+10.461
25.52%
jan 1, 2007
39.376
-12.07
-23.46%
jan 1, 2008
45.459
+6.082
15.45%
jan 1, 2009
42.758
-2.701
-5.94%
jan 1, 2010
42.538
-0.22
-0.51%
jan 1, 2011
45.205
+2.667
6.27%
jan 1, 2012
47.512
+2.307
5.1%
jan 1, 2013
54.344
+6.833
14.38%
jan 1, 2014
48.776
-5.568
-10.25%
jan 1, 2015
60.75
+11.973
24.55%
Ranking of countries by current statistics by years


Comments: