29
/
en
AIzaSyAYiBZKx7MnpbEhh9jyipgxe19OcubqV5w
April 1, 2024
75481
Azerbaijan
AZE
true
2
1
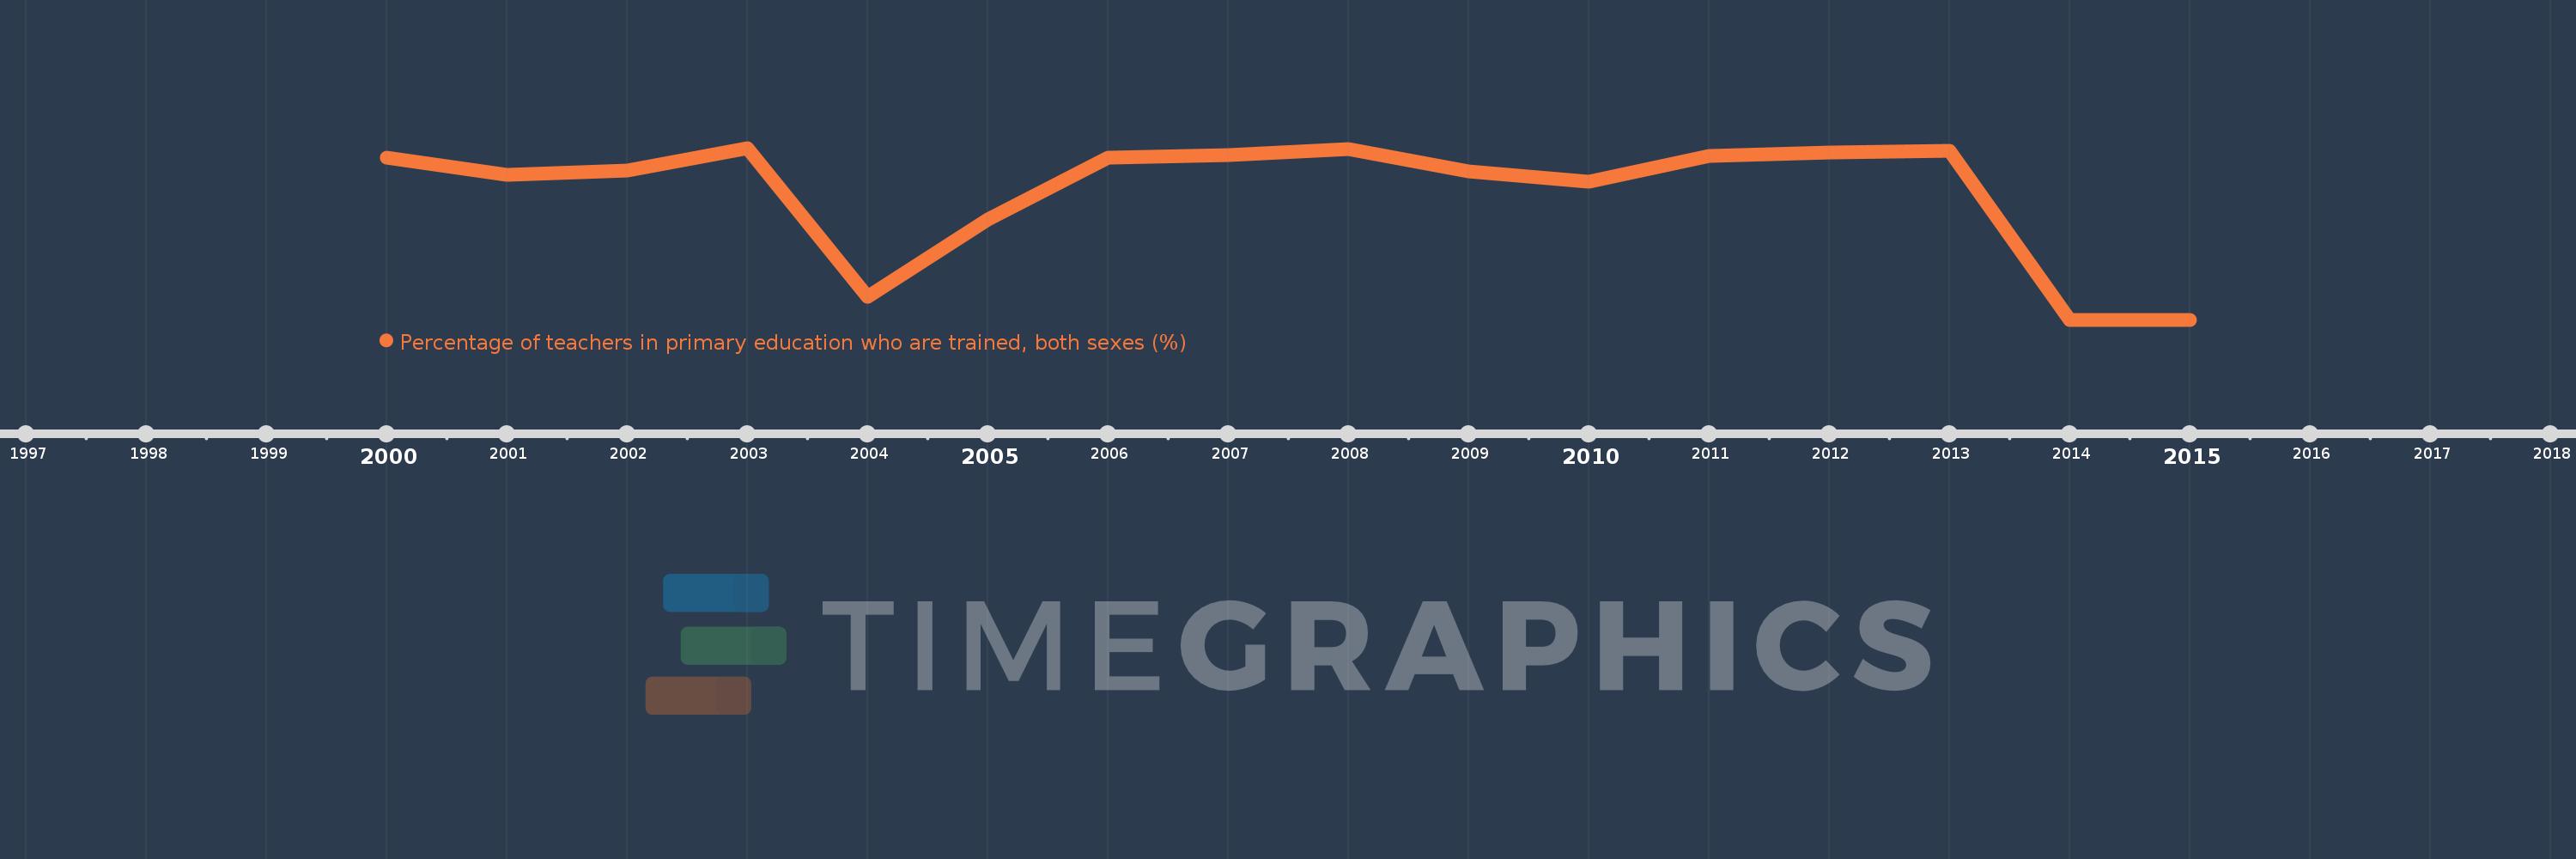
Percentage of teachers in primary education who are trained, both sexes (%)
2015,2014,2013,2012,2011,2010,2009,2008,2007,2006,2005,2004,2003,2002,2001,2000
This statistics in other country:
Timeline:
This timeline shows a graph from 2000 to 2015 of Azerbaijan. No data until 1999. Number of actual observations by date: 16.
Source name:
World Development Indicators
Source organization:
United Nations Educational, Scientific, and Cultural Organization (UNESCO) Institute for Statistics.
Categories, topics:
Education
Last updated:
apr 23, 2017
Indicators value changes by year
Minimum:
99.568
jan 1, 2014
At the date of observation
Value
Absolute change
Change from previous value
jan 1, 2000
99.976
+99.976
0.0%
jan 1, 2001
99.933
-0.042
-0.04%
jan 1, 2002
99.943
+0.01
0.01%
jan 1, 2003
100.0
+0.057
0.06%
jan 1, 2004
99.625
-0.375
-0.37%
jan 1, 2005
99.819
+0.194
0.19%
jan 1, 2006
99.976
+0.157
0.16%
jan 1, 2007
99.981
+0.005
0.01%
jan 1, 2008
99.998
+0.016
0.02%
jan 1, 2009
99.941
-0.057
-0.06%
jan 1, 2010
99.916
-0.025
-0.02%
jan 1, 2011
99.979
+0.063
0.06%
jan 1, 2012
99.988
+0.009
0.01%
jan 1, 2013
99.993
+0.004
0.0%
jan 1, 2014
99.568
-0.424
-0.42%
jan 1, 2015
99.568
0.0
0.0%
Ranking of countries by current statistics by years


Comments: