29
/
en
AIzaSyAYiBZKx7MnpbEhh9jyipgxe19OcubqV5w
April 1, 2024
61088
Sub-Saharan Africa (IDA & IBRD countries)
TSS
false
2
1
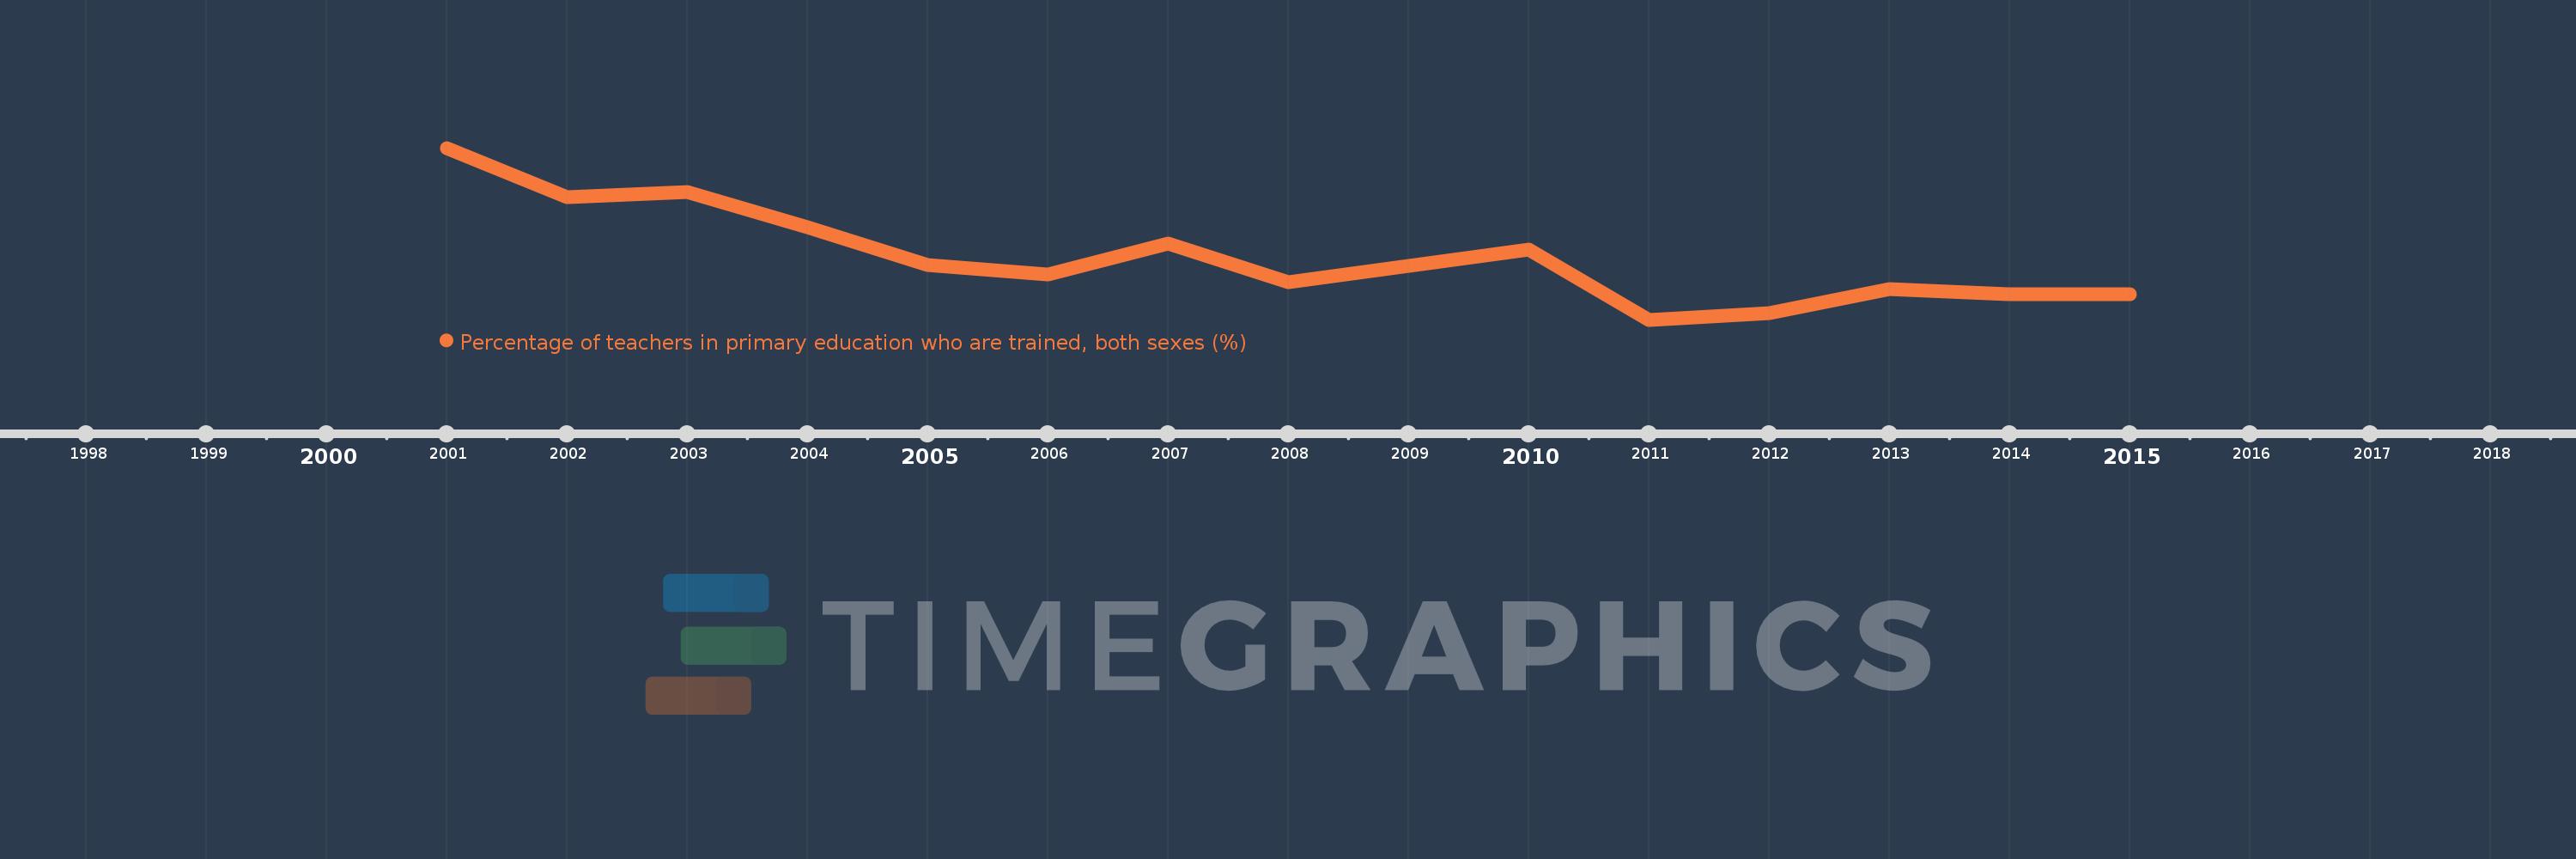
Percentage of teachers in primary education who are trained, both sexes (%)
2015,2014,2013,2012,2011,2010,2009,2008,2007,2006,2005,2004,2003,2002,2001
This statistics in other country:
Timeline:
This timeline shows a graph from 2001 to 2015 of Sub-Saharan Africa (IDA & IBRD countries). No data until 2000. Number of actual observations by date: 15.
Source name:
World Development Indicators
Source organization:
United Nations Educational, Scientific, and Cultural Organization (UNESCO) Institute for Statistics.
Categories, topics:
Education
Last updated:
apr 23, 2017
Indicators value changes by year
Minimum:
73.467
jan 1, 2011
Maximum:
81.517
jan 1, 2001
At the date of observation
Value
Absolute change
Change from previous value
jan 1, 2001
81.517
+81.517
0.0%
jan 1, 2002
79.222
-2.295
-2.82%
jan 1, 2003
79.439
+0.217
0.27%
jan 1, 2004
77.793
-1.647
-2.07%
jan 1, 2005
76.036
-1.756
-2.26%
jan 1, 2006
75.588
-0.448
-0.59%
jan 1, 2007
77.038
+1.45
1.92%
jan 1, 2008
75.243
-1.795
-2.33%
jan 1, 2009
75.972
+0.729
0.97%
jan 1, 2010
76.775
+0.803
1.06%
jan 1, 2011
73.467
-3.308
-4.31%
jan 1, 2012
73.776
+0.309
0.42%
jan 1, 2013
74.923
+1.147
1.55%
jan 1, 2014
74.675
-0.248
-0.33%
jan 1, 2015
74.655
-0.02
-0.03%
Ranking of countries by current statistics by years


Comments: