29
/
en
AIzaSyAYiBZKx7MnpbEhh9jyipgxe19OcubqV5w
April 1, 2024
24420
Arab World
ARB
false
2
1
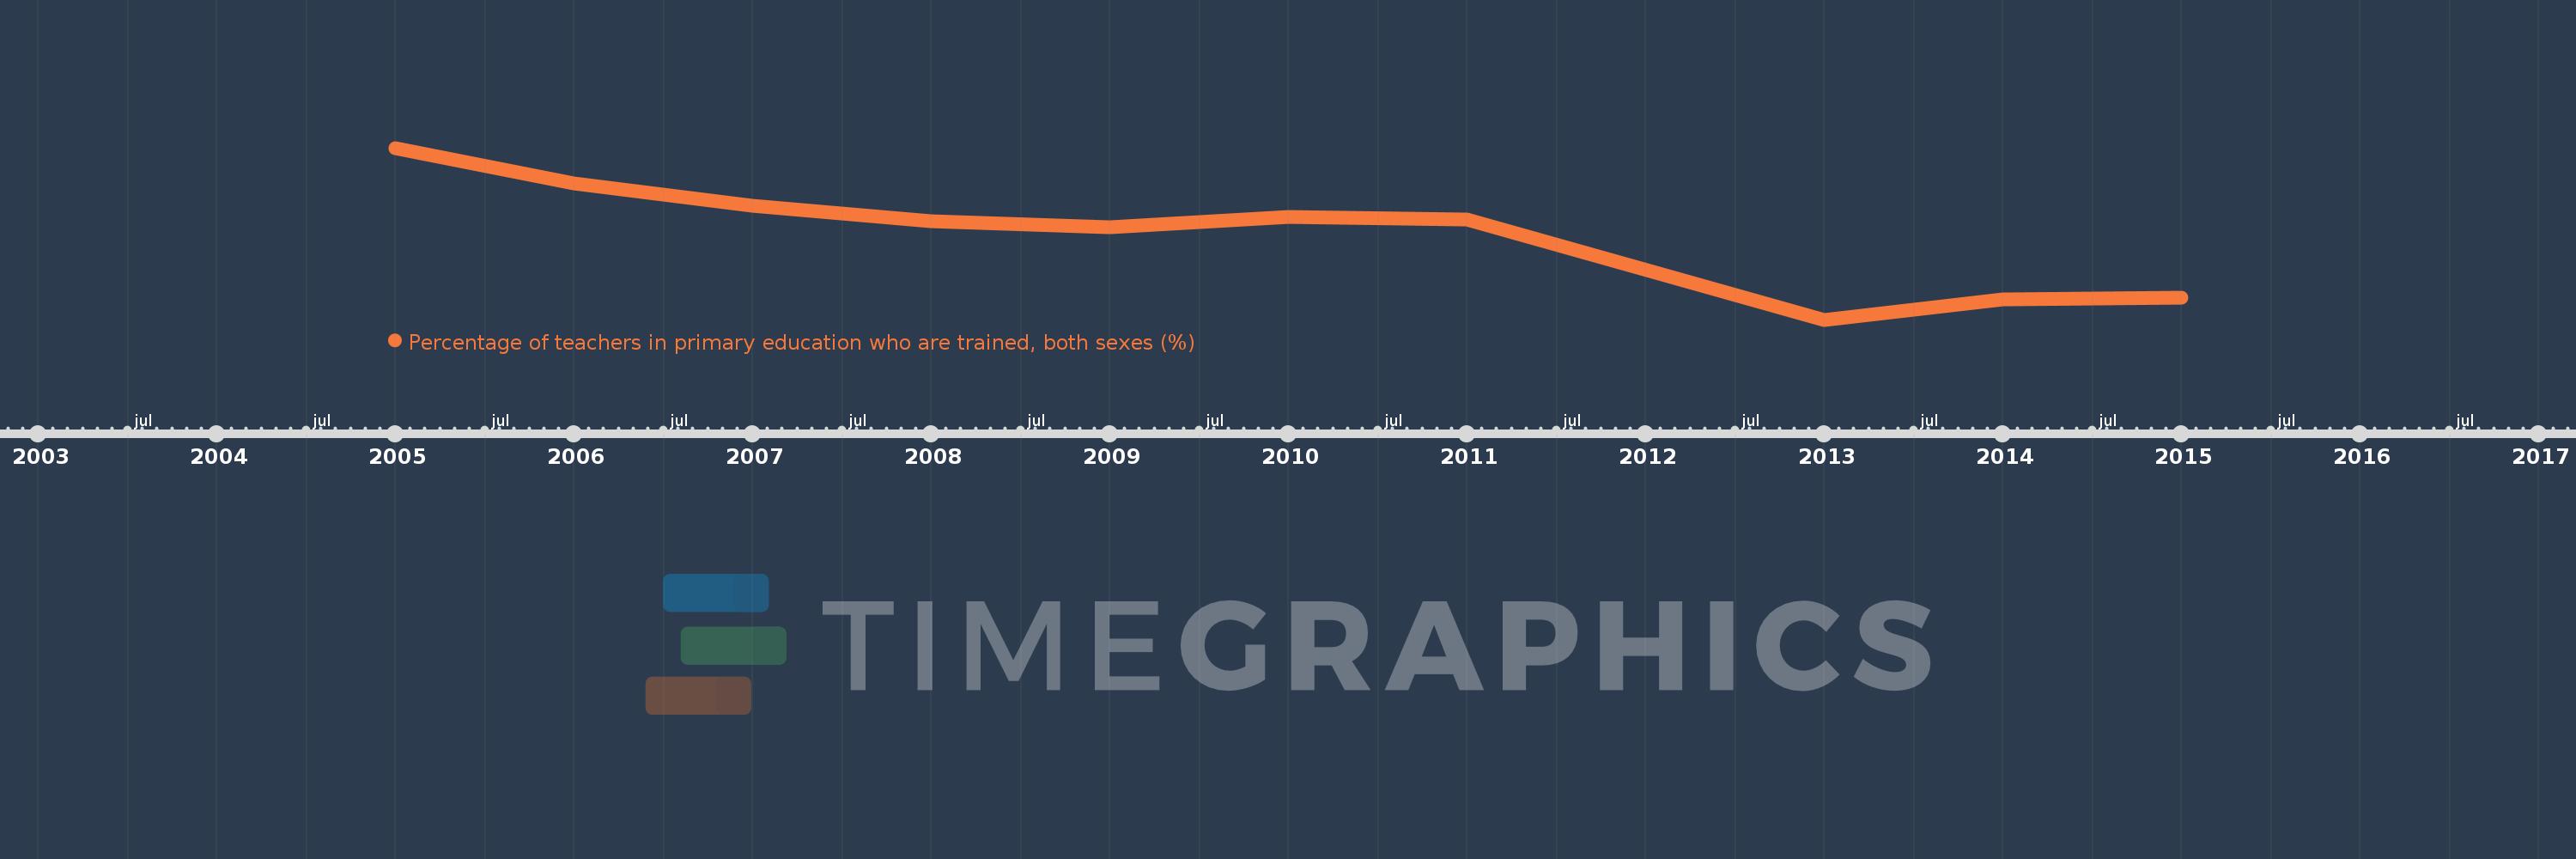
Percentage of teachers in primary education who are trained, both sexes (%)
2015,2014,2013,2011,2010,2009,2008,2007,2006,2005
This statistics in other country:
Timeline:
This timeline shows a graph from 2005 to 2015 of Arab World. No data until 2004. Number of actual observations by date: 10.
Source name:
World Development Indicators
Source organization:
United Nations Educational, Scientific, and Cultural Organization (UNESCO) Institute for Statistics.
Categories, topics:
Education
Last updated:
apr 23, 2017
Indicators value changes by year
Minimum:
83.114
jan 1, 2013
Maximum:
96.563
jan 1, 2005
At the date of observation
Value
Absolute change
Change from previous value
jan 1, 2005
96.563
+96.563
0.0%
jan 1, 2006
93.793
-2.77
-2.87%
jan 1, 2007
92.043
-1.75
-1.87%
jan 1, 2008
90.85
-1.193
-1.3%
jan 1, 2009
90.366
-0.484
-0.53%
jan 1, 2010
91.169
+0.802
0.89%
jan 1, 2011
90.932
-0.237
-0.26%
jan 1, 2013
83.114
-7.818
-8.6%
jan 1, 2014
84.74
+1.626
1.96%
jan 1, 2015
84.865
+0.126
0.15%
Ranking of countries by current statistics by years


Comments: