29
/
en
AIzaSyAYiBZKx7MnpbEhh9jyipgxe19OcubqV5w
April 1, 2024
69154
Antigua and Barbuda
ATG
true
2
1
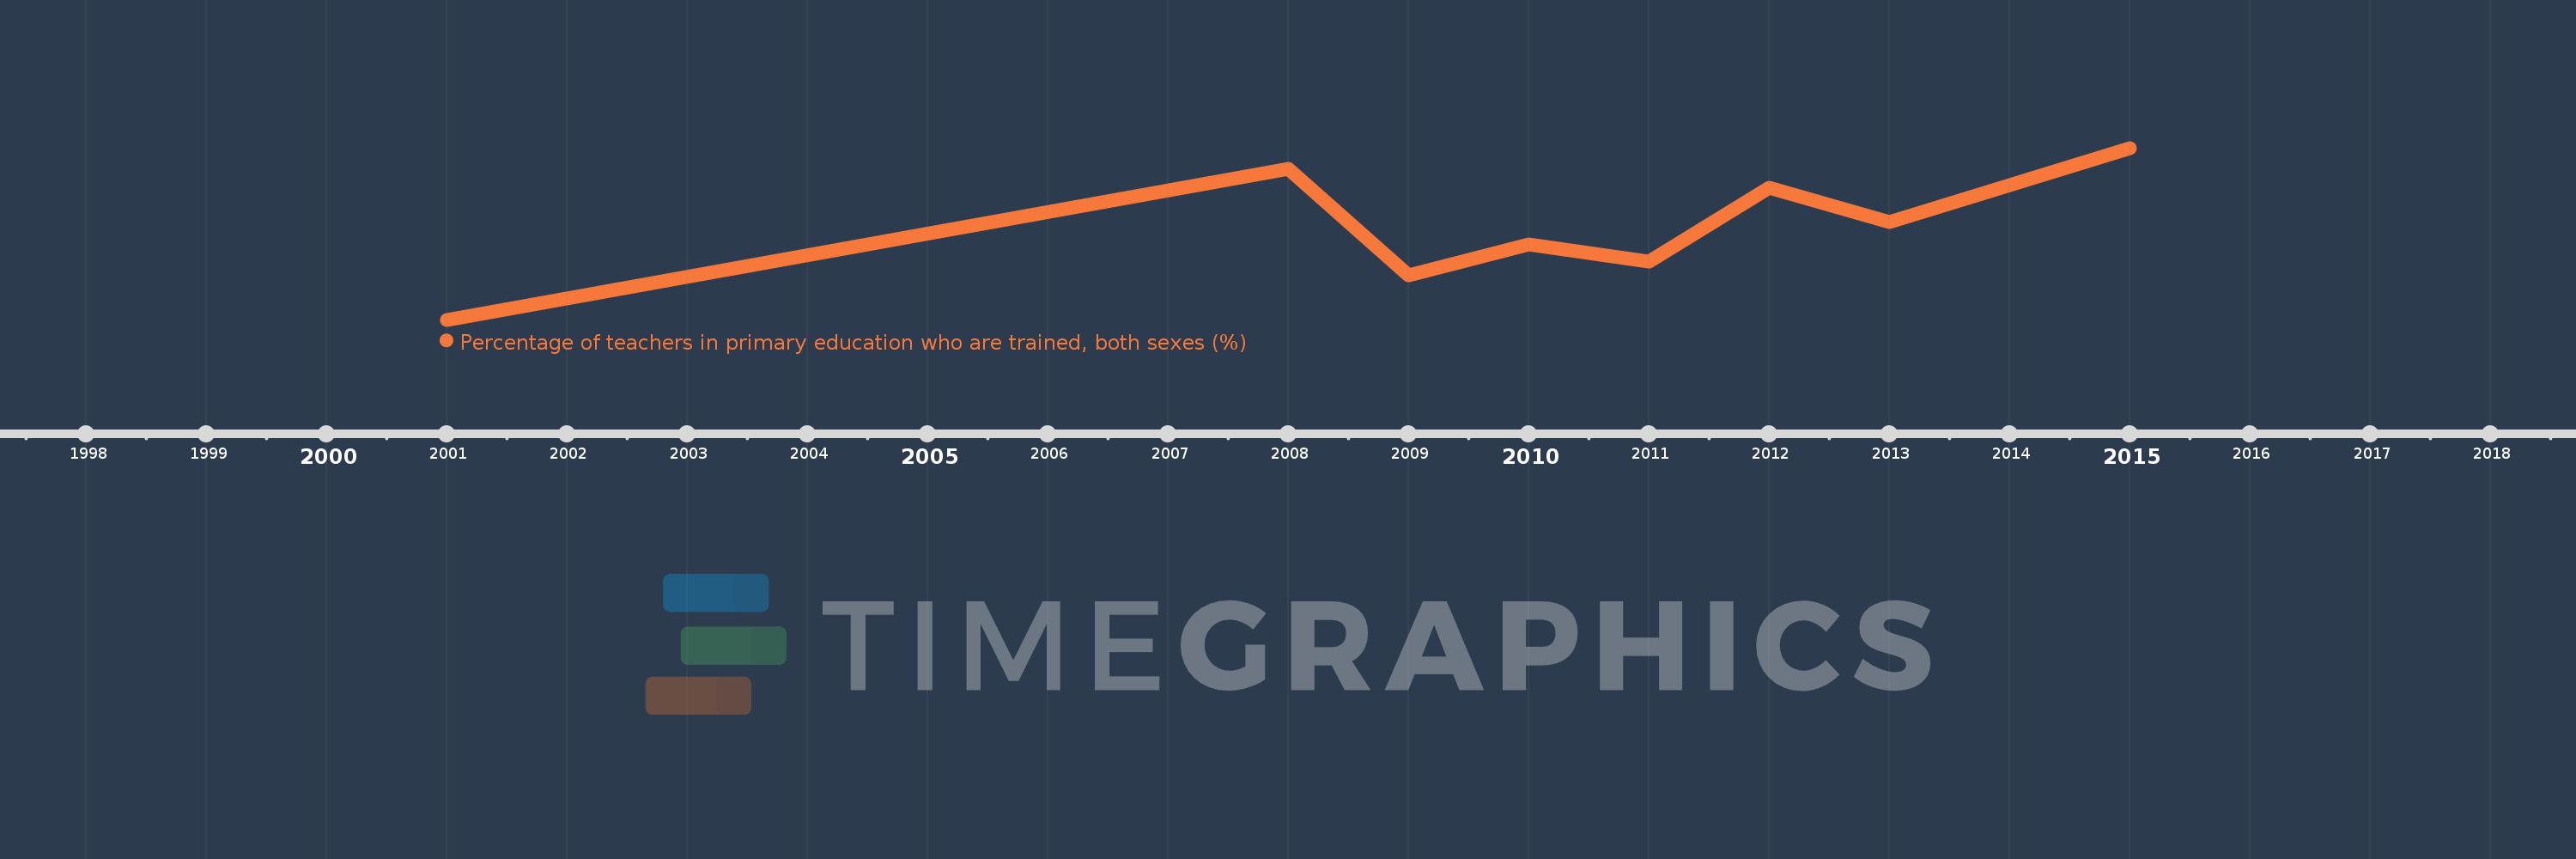
Percentage of teachers in primary education who are trained, both sexes (%)
2015,2013,2012,2011,2010,2009,2008,2001
This statistics in other country:
Timeline:
This timeline shows a graph from 2001 to 2015 of Antigua and Barbuda. No data until 2000. Number of actual observations by date: 8.
Source name:
World Development Indicators
Source organization:
United Nations Educational, Scientific, and Cultural Organization (UNESCO) Institute for Statistics.
Categories, topics:
Education
Last updated:
apr 23, 2017
Indicators value changes by year
Minimum:
46.906
jan 1, 2001
Maximum:
70.168
jan 1, 2015
At the date of observation
Value
Absolute change
Change from previous value
jan 1, 2001
46.906
+46.906
0.0%
jan 1, 2008
67.286
+20.38
43.45%
jan 1, 2009
52.889
-14.397
-21.4%
jan 1, 2010
57.122
+4.233
8.0%
jan 1, 2011
54.752
-2.37
-4.15%
jan 1, 2012
64.84
+10.087
18.42%
jan 1, 2013
60.132
-4.707
-7.26%
jan 1, 2015
70.168
+10.036
16.69%
Ranking of countries by current statistics by years


Comments: