29
/
en
AIzaSyAYiBZKx7MnpbEhh9jyipgxe19OcubqV5w
April 1, 2024
40231
IDA total
IDA
false
2
1
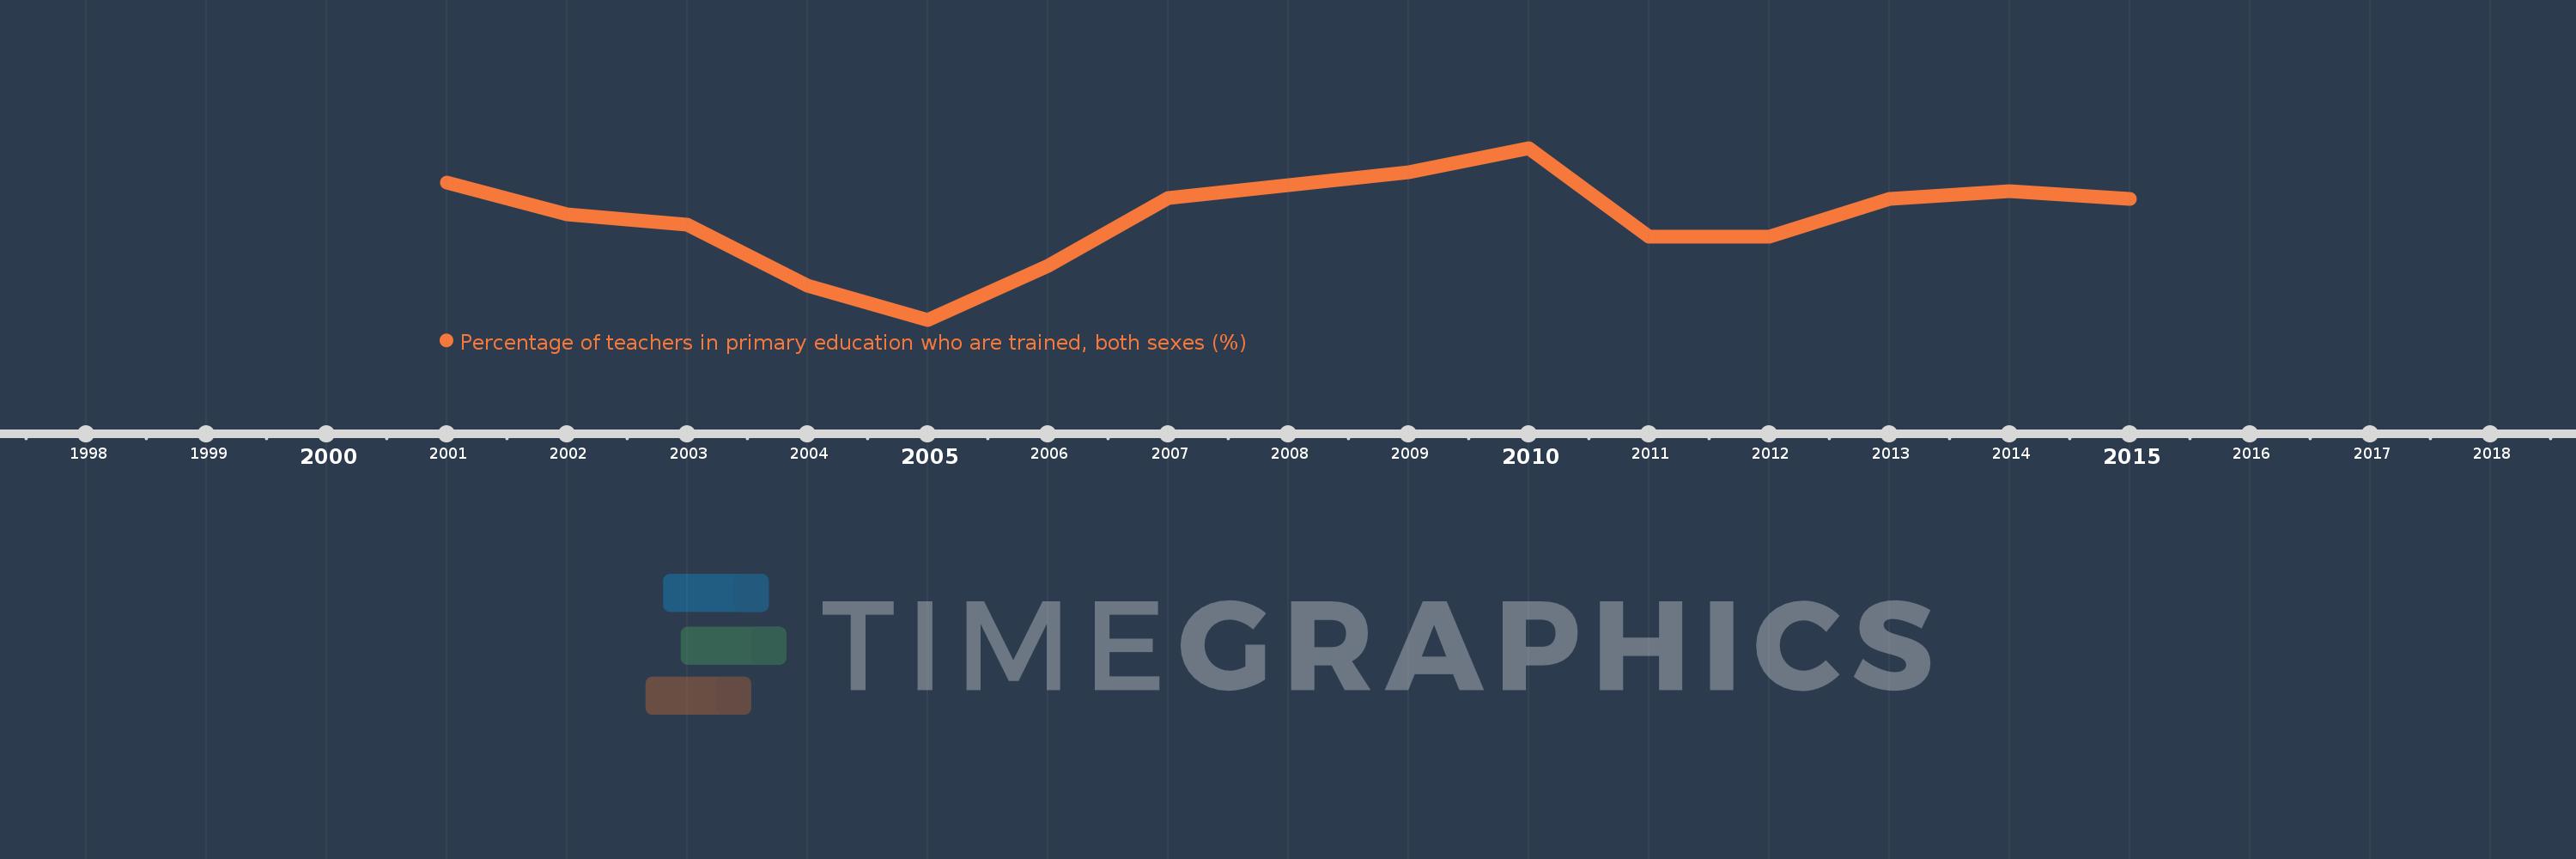
Percentage of teachers in primary education who are trained, both sexes (%)
2015,2014,2013,2012,2011,2010,2009,2008,2007,2006,2005,2004,2003,2002,2001
This statistics in other country:
Timeline:
This timeline shows a graph from 2001 to 2015 of IDA total. No data until 2000. Number of actual observations by date: 15.
Source name:
World Development Indicators
Source organization:
United Nations Educational, Scientific, and Cultural Organization (UNESCO) Institute for Statistics.
Categories, topics:
Education
Last updated:
apr 23, 2017
Indicators value changes by year
Maximum:
79.348
jan 1, 2010
At the date of observation
Value
Absolute change
Change from previous value
jan 1, 2001
78.483
+78.483
0.0%
jan 1, 2002
77.701
-0.783
-1.0%
jan 1, 2003
77.424
-0.277
-0.36%
jan 1, 2004
75.919
-1.504
-1.94%
jan 1, 2005
75.06
-0.86
-1.13%
jan 1, 2006
76.396
+1.336
1.78%
jan 1, 2007
78.091
+1.694
2.22%
jan 1, 2008
78.426
+0.335
0.43%
jan 1, 2009
78.742
+0.317
0.4%
jan 1, 2010
79.348
+0.606
0.77%
jan 1, 2011
77.125
-2.223
-2.8%
jan 1, 2012
77.137
+0.011
0.01%
jan 1, 2013
78.071
+0.934
1.21%
jan 1, 2014
78.27
+0.199
0.26%
jan 1, 2015
78.078
-0.193
-0.25%
Ranking of countries by current statistics by years


Comments: