29
/
en
AIzaSyAYiBZKx7MnpbEhh9jyipgxe19OcubqV5w
April 1, 2024
81013
Belarus
BLR
true
2
1
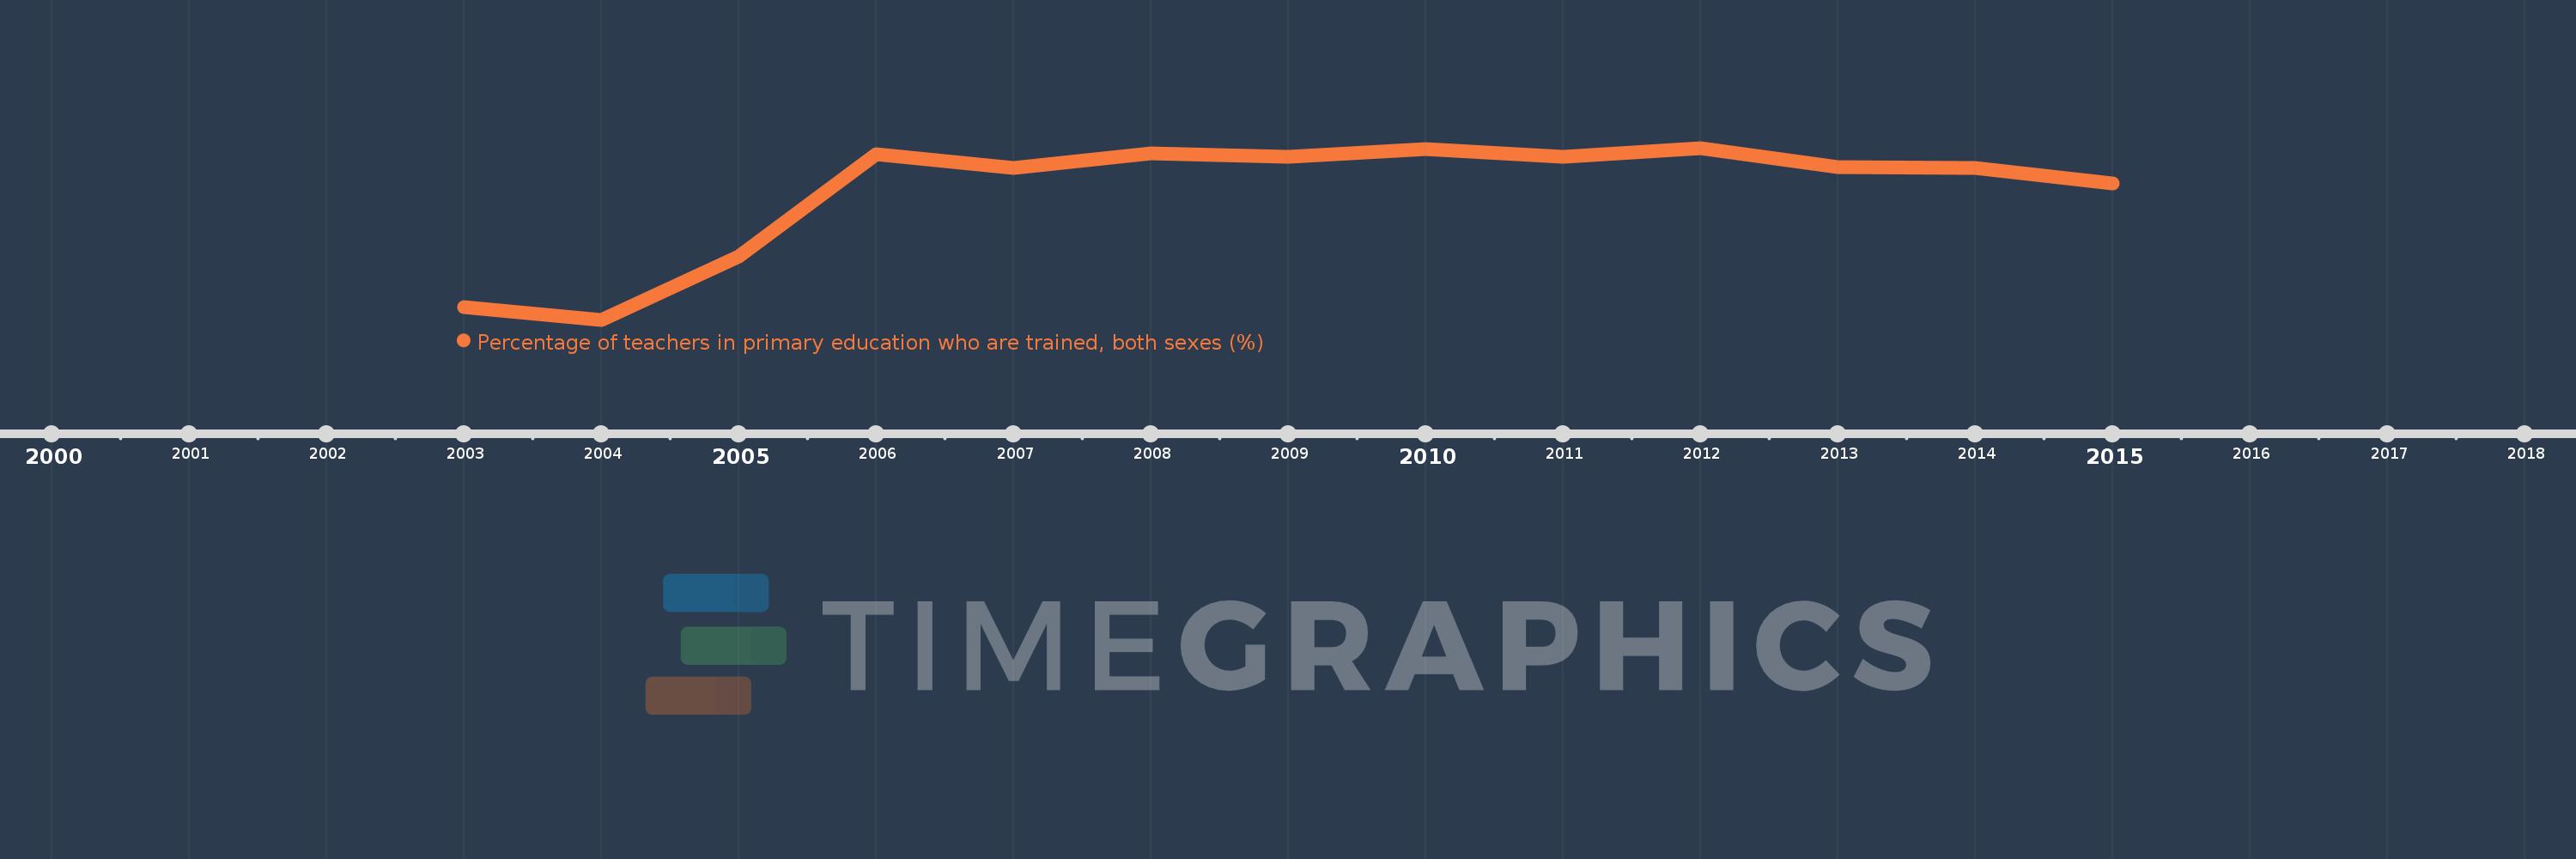
Percentage of teachers in primary education who are trained, both sexes (%)
2015,2014,2013,2012,2011,2010,2009,2008,2007,2006,2005,2004,2003
This statistics in other country:
Timeline:
This timeline shows a graph from 2003 to 2015 of Belarus. No data until 2002. Number of actual observations by date: 13.
Source name:
World Development Indicators
Source organization:
United Nations Educational, Scientific, and Cultural Organization (UNESCO) Institute for Statistics.
Categories, topics:
Education
Last updated:
apr 23, 2017
Indicators value changes by year
Minimum:
97.742
jan 1, 2004
Maximum:
99.877
jan 1, 2012
At the date of observation
Value
Absolute change
Change from previous value
jan 1, 2003
97.904
+97.904
0.0%
jan 1, 2004
97.742
-0.161
-0.16%
jan 1, 2005
98.528
+0.785
0.8%
jan 1, 2006
99.797
+1.269
1.29%
jan 1, 2007
99.63
-0.168
-0.17%
jan 1, 2008
99.81
+0.18
0.18%
jan 1, 2009
99.772
-0.039
-0.04%
jan 1, 2010
99.866
+0.095
0.09%
jan 1, 2011
99.762
-0.105
-0.1%
jan 1, 2012
99.877
+0.116
0.12%
jan 1, 2013
99.644
-0.233
-0.23%
jan 1, 2014
99.629
-0.015
-0.02%
jan 1, 2015
99.437
-0.191
-0.19%
Ranking of countries by current statistics by years


Comments: