29
/
en
AIzaSyAYiBZKx7MnpbEhh9jyipgxe19OcubqV5w
April 1, 2024
204512
Myanmar
MMR
true
2
1
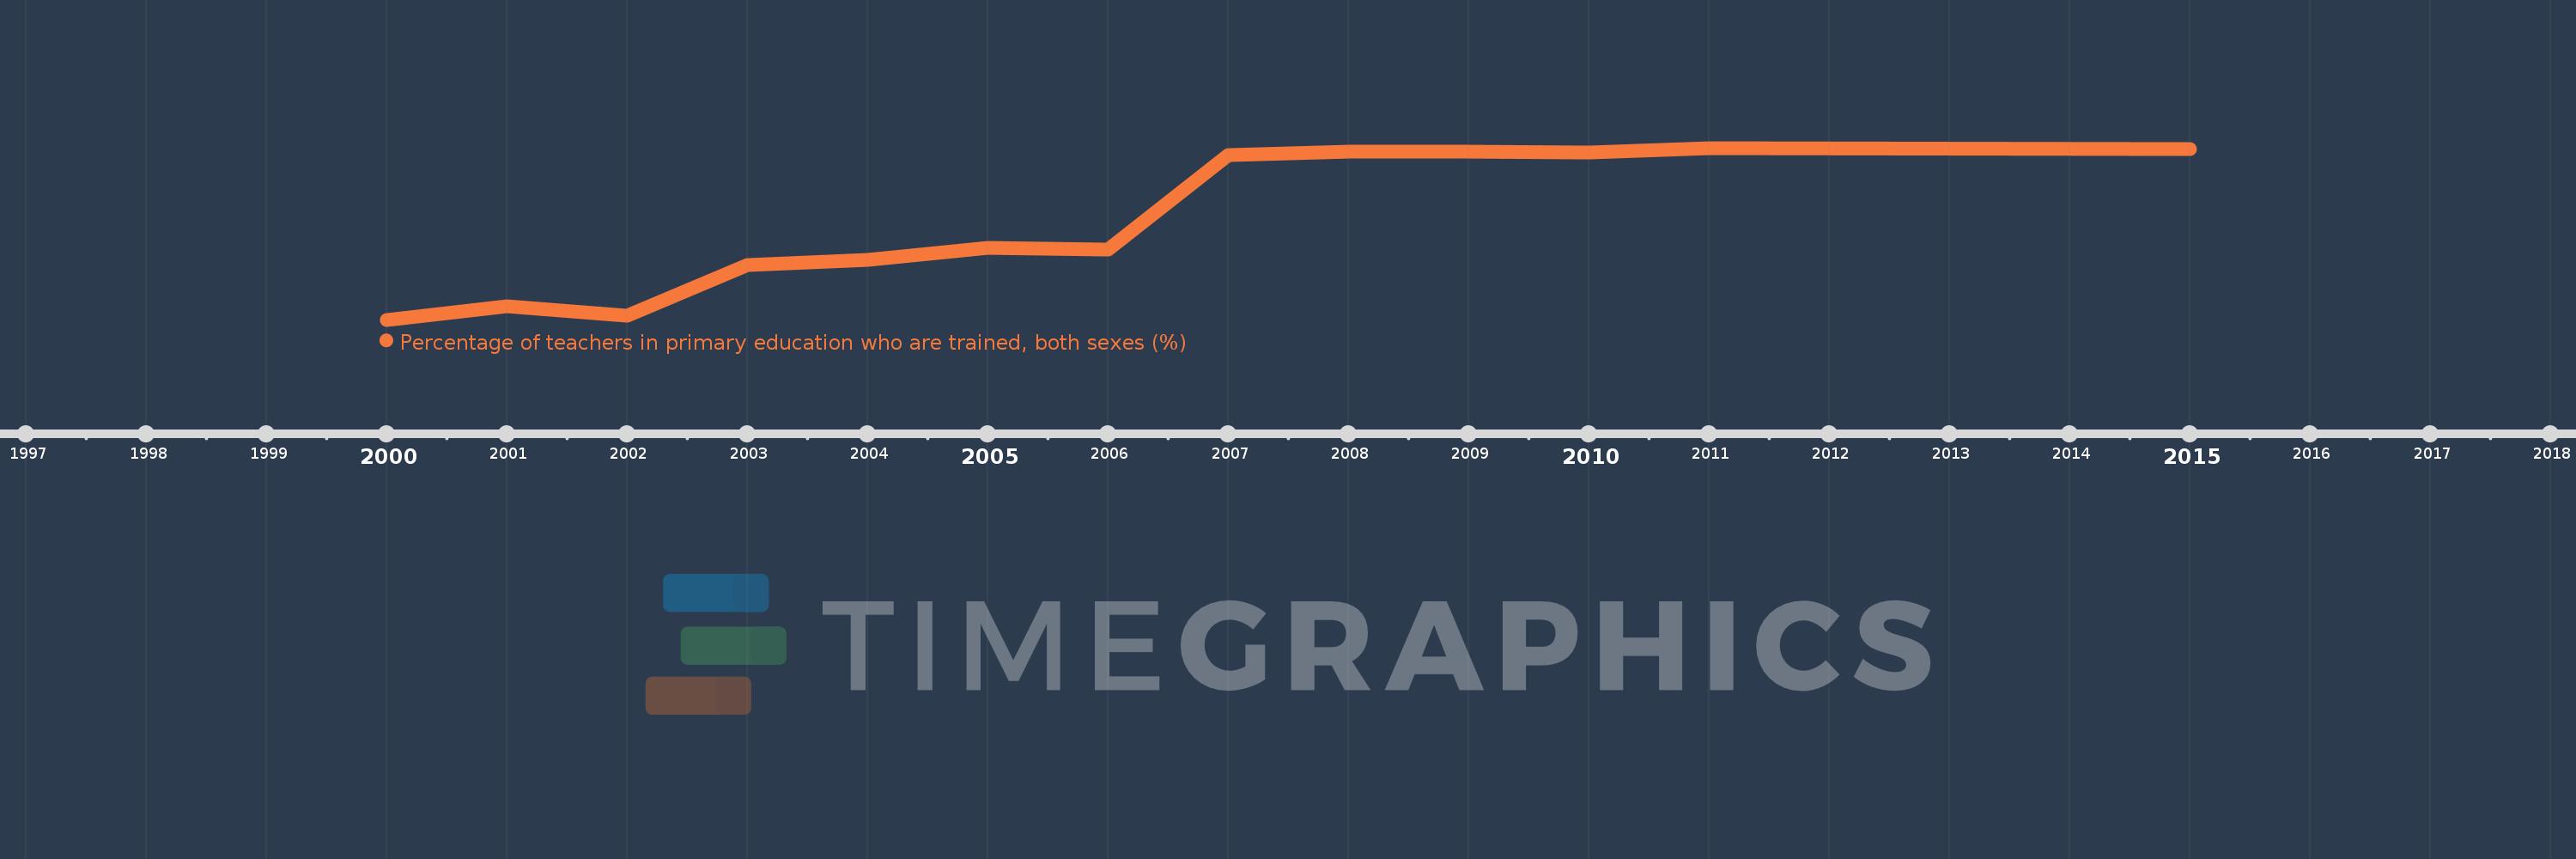
Percentage of teachers in primary education who are trained, both sexes (%)
2015,2011,2010,2009,2008,2007,2006,2005,2004,2003,2002,2001,2000
This statistics in other country:
Timeline:
This timeline shows a graph from 2000 to 2015 of Myanmar. No data until 1999. Number of actual observations by date: 13.
Source name:
World Development Indicators
Source organization:
United Nations Educational, Scientific, and Cultural Organization (UNESCO) Institute for Statistics.
Categories, topics:
Education
Last updated:
apr 23, 2017
Indicators value changes by year
Minimum:
59.576
jan 1, 2000
At the date of observation
Value
Absolute change
Change from previous value
jan 1, 2000
59.576
+59.576
0.0%
jan 1, 2001
62.702
+3.126
5.25%
jan 1, 2002
60.429
-2.273
-3.62%
jan 1, 2003
72.485
+12.055
19.95%
jan 1, 2004
73.665
+1.181
1.63%
jan 1, 2005
76.393
+2.727
3.7%
jan 1, 2006
76.0
-0.392
-0.51%
jan 1, 2007
98.271
+22.271
29.3%
jan 1, 2008
99.0
+0.729
0.74%
jan 1, 2010
98.87
-0.13
-0.13%
jan 1, 2011
99.86
+0.99
1.0%
jan 1, 2015
99.548
-0.312
-0.31%
Ranking of countries by current statistics by years


Comments: