29
/
en
AIzaSyAYiBZKx7MnpbEhh9jyipgxe19OcubqV5w
April 1, 2024
231511
Rwanda
RWA
true
2
1
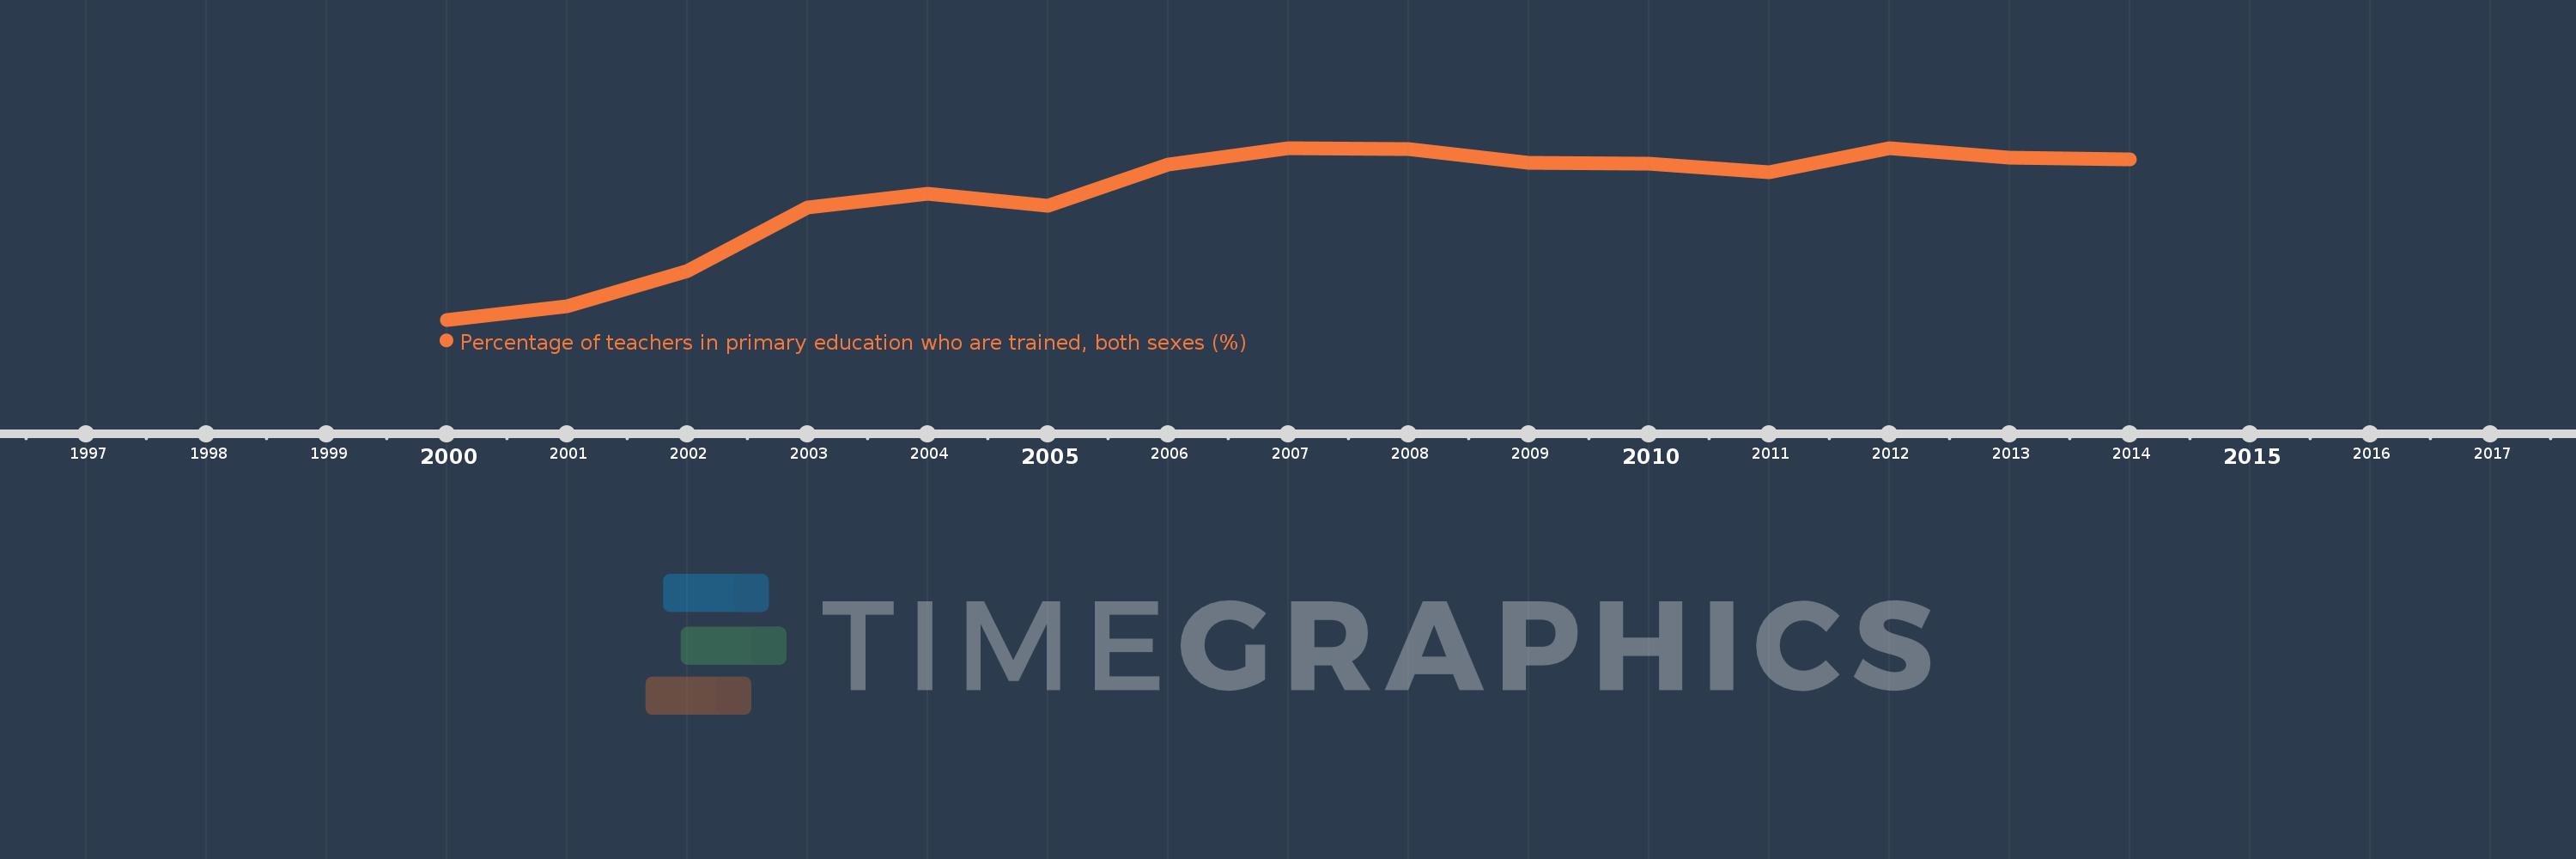
Percentage of teachers in primary education who are trained, both sexes (%)
2014,2013,2012,2011,2010,2009,2008,2007,2006,2005,2004,2003,2002,2001,2000
This statistics in other country:
Timeline:
This timeline shows a graph from 2000 to 2014 of Rwanda. No data until 1999. Number of actual observations by date: 15.
Source name:
World Development Indicators
Source organization:
United Nations Educational, Scientific, and Cultural Organization (UNESCO) Institute for Statistics.
Categories, topics:
Education
Last updated:
apr 23, 2017
Indicators value changes by year
Minimum:
48.635
jan 1, 2000
Maximum:
98.427
jan 1, 2012
At the date of observation
Value
Absolute change
Change from previous value
jan 1, 2000
48.635
+48.635
0.0%
jan 1, 2001
52.583
+3.948
8.12%
jan 1, 2002
62.705
+10.122
19.25%
jan 1, 2003
81.167
+18.463
29.44%
jan 1, 2004
85.182
+4.015
4.95%
jan 1, 2005
81.712
-3.47
-4.07%
jan 1, 2006
93.731
+12.019
14.71%
jan 1, 2007
98.299
+4.568
4.87%
jan 1, 2008
98.07
-0.229
-0.23%
jan 1, 2009
94.162
-3.908
-3.99%
jan 1, 2010
93.872
-0.29
-0.31%
jan 1, 2011
91.479
-2.393
-2.55%
jan 1, 2012
98.427
+6.948
7.59%
jan 1, 2013
95.559
-2.868
-2.91%
jan 1, 2014
95.204
-0.355
-0.37%
Ranking of countries by current statistics by years


Comments: