29
/
en
AIzaSyAYiBZKx7MnpbEhh9jyipgxe19OcubqV5w
April 1, 2024
216910
Pakistan
PAK
true
2
1
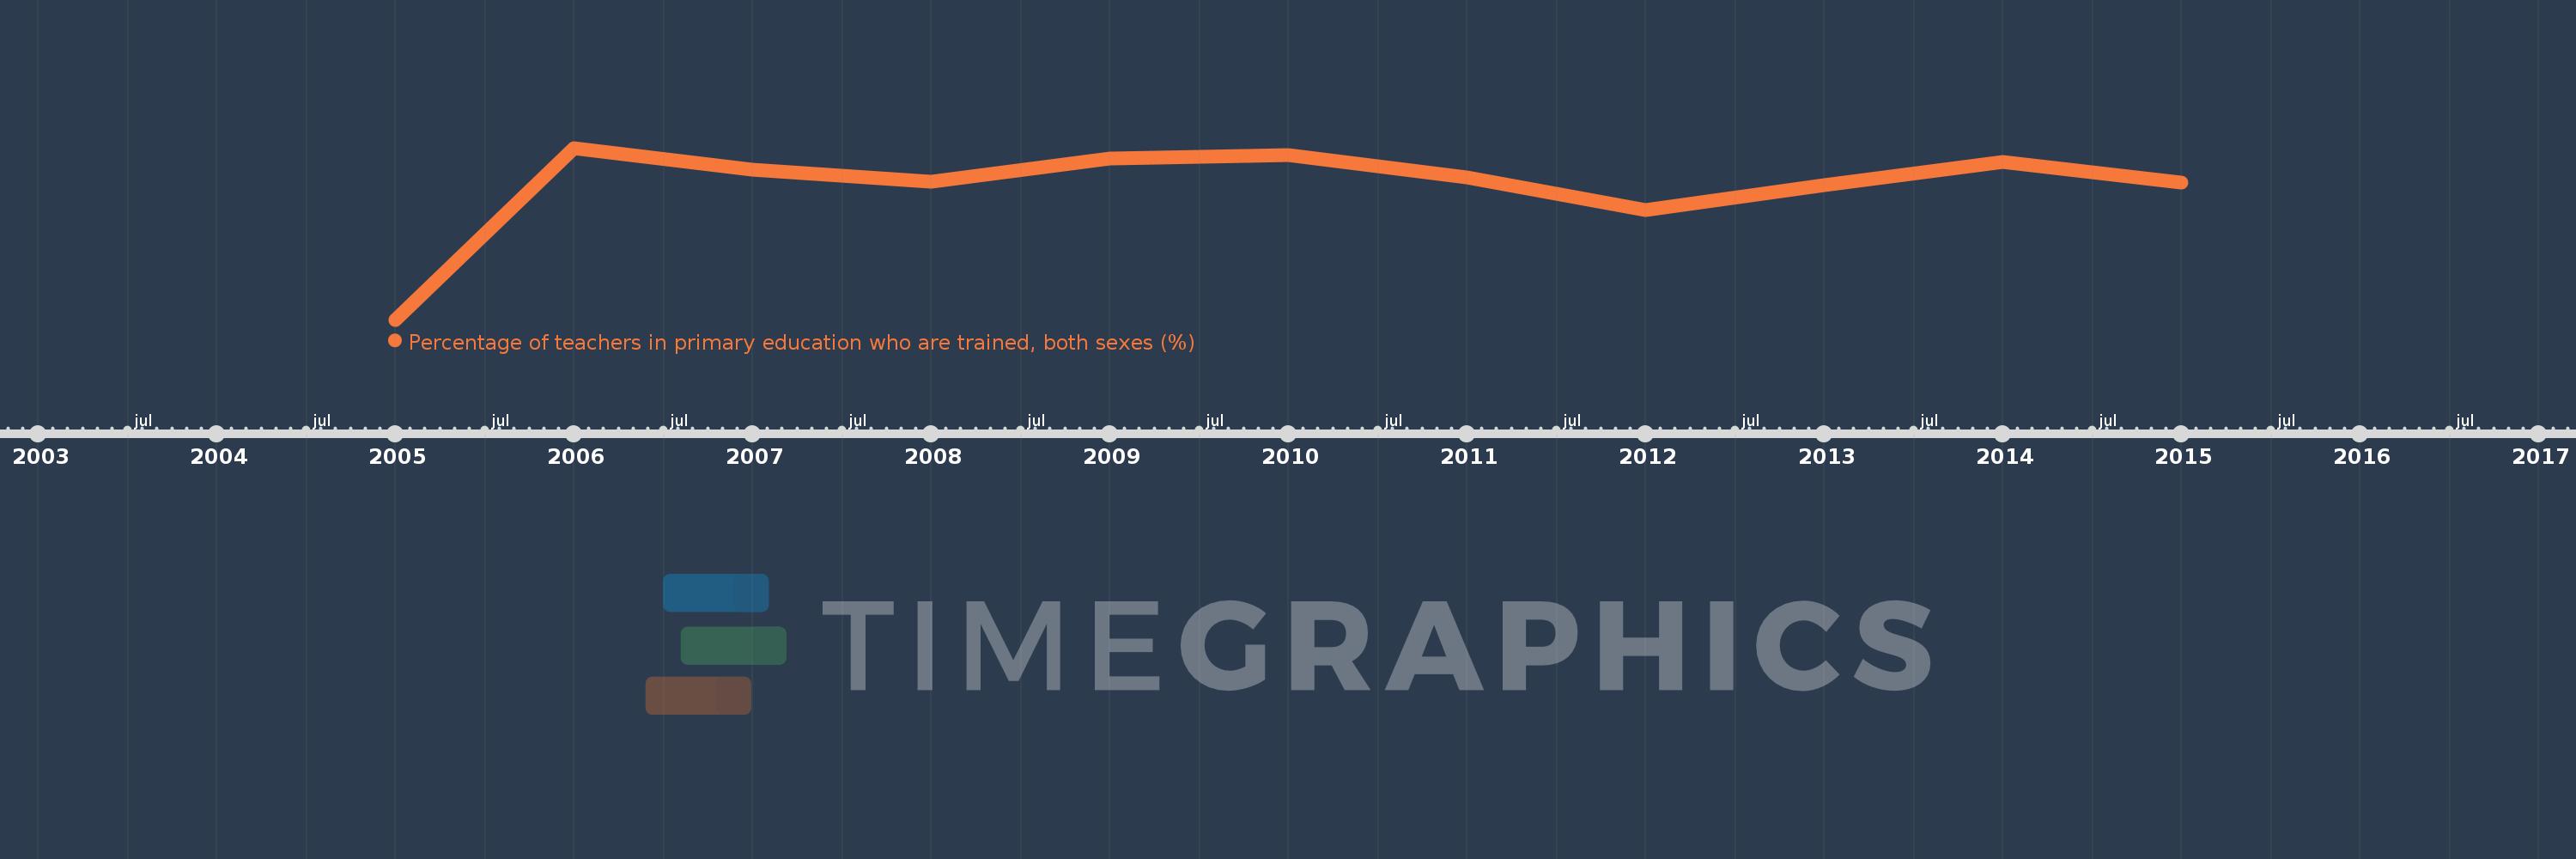
Percentage of teachers in primary education who are trained, both sexes (%)
2015,2014,2013,2012,2011,2010,2009,2008,2007,2006,2005
This statistics in other country:
Timeline:
This timeline shows a graph from 2005 to 2015 of Pakistan. No data until 2004. Number of actual observations by date: 11.
Source name:
World Development Indicators
Source organization:
United Nations Educational, Scientific, and Cultural Organization (UNESCO) Institute for Statistics.
Categories, topics:
Education
Last updated:
apr 23, 2017
Indicators value changes by year
Minimum:
78.045
jan 1, 2005
Maximum:
85.507
jan 1, 2006
At the date of observation
Value
Absolute change
Change from previous value
jan 1, 2005
78.045
+78.045
0.0%
jan 1, 2006
85.507
+7.462
9.56%
jan 1, 2007
84.58
-0.927
-1.08%
jan 1, 2008
84.036
-0.544
-0.64%
jan 1, 2009
85.062
+1.026
1.22%
jan 1, 2010
85.188
+0.126
0.15%
jan 1, 2011
84.226
-0.962
-1.13%
jan 1, 2012
82.805
-1.421
-1.69%
jan 1, 2013
83.907
+1.102
1.33%
jan 1, 2014
84.898
+0.991
1.18%
jan 1, 2015
84.013
-0.885
-1.04%
Ranking of countries by current statistics by years


Comments: