29
/
en
AIzaSyAYiBZKx7MnpbEhh9jyipgxe19OcubqV5w
April 1, 2024
41803
Latin America & Caribbean
LCN
false
2
1
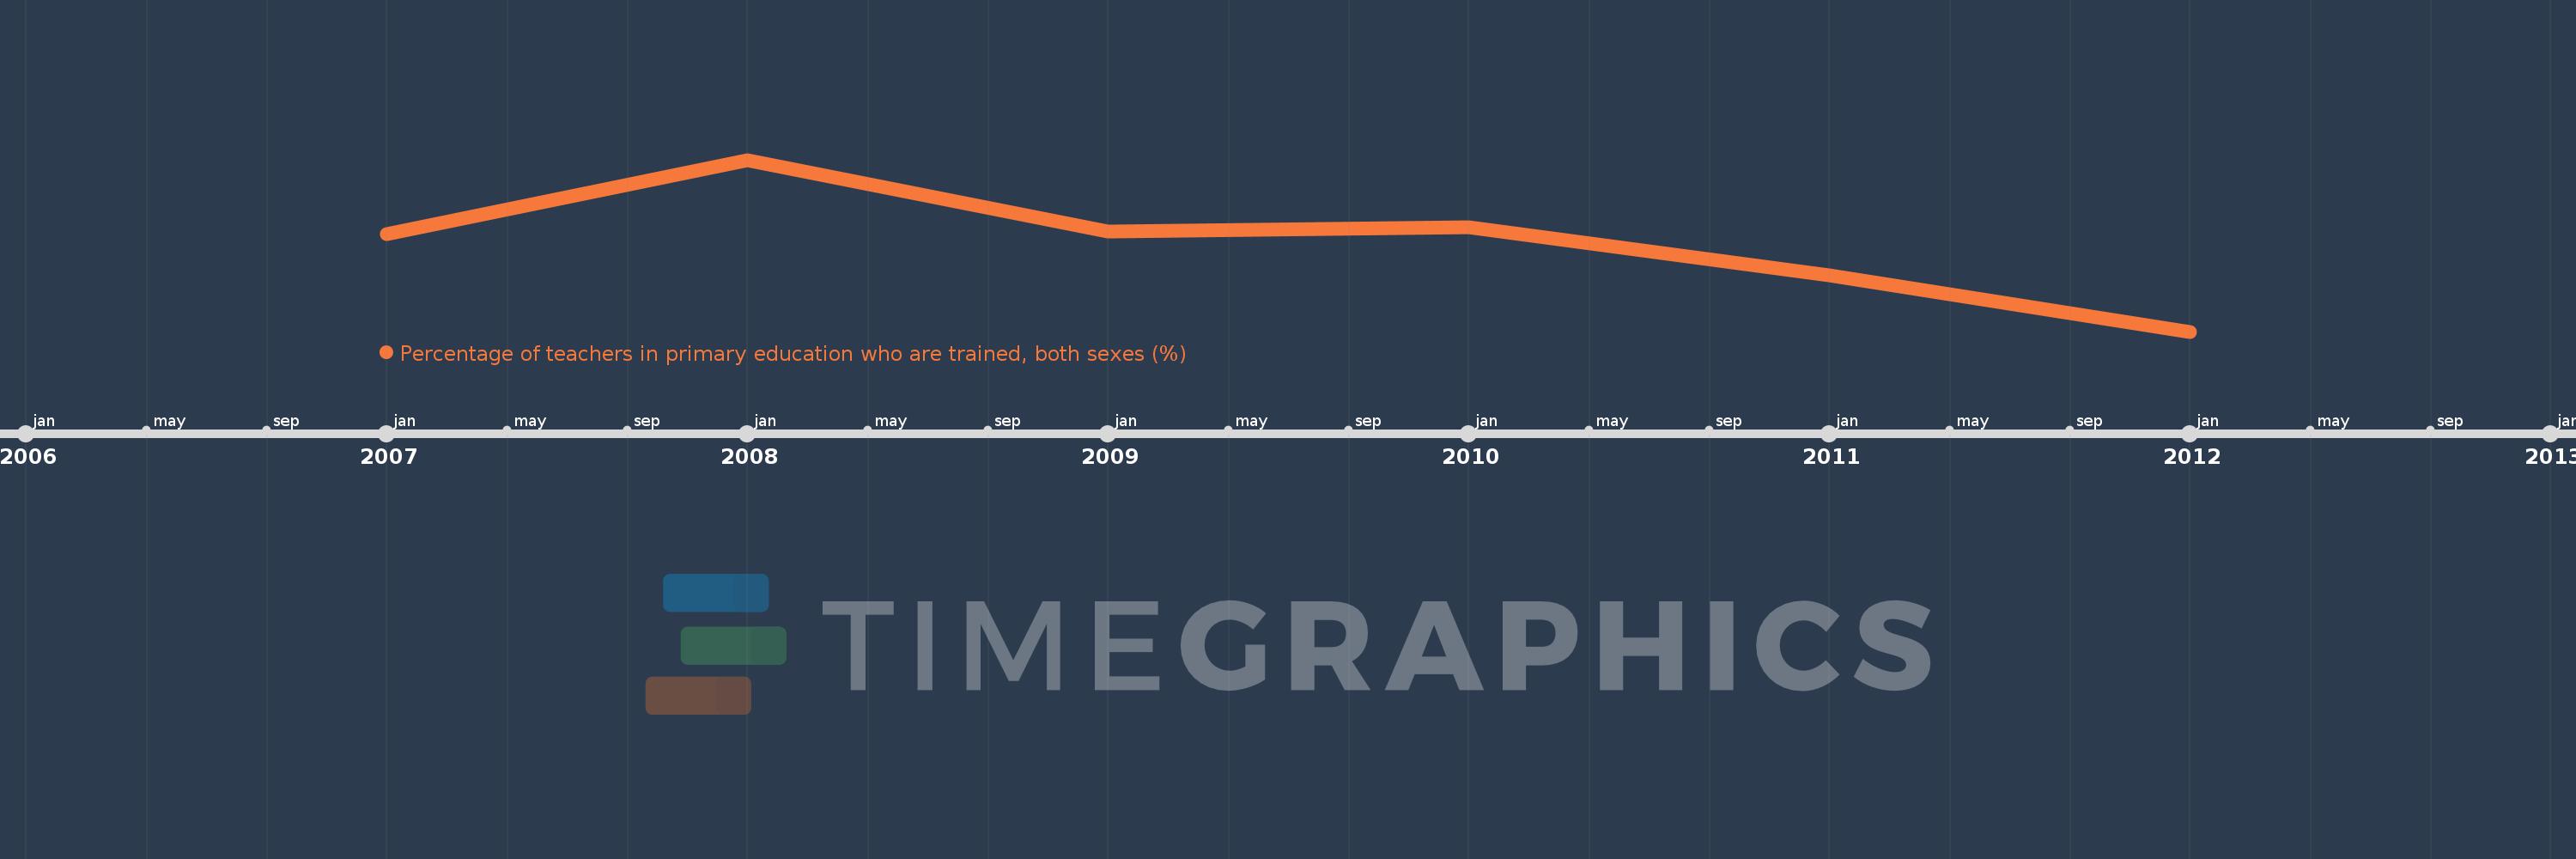
Percentage of teachers in primary education who are trained, both sexes (%)
2012,2011,2010,2009,2008,2007
This statistics in other country:
Timeline:
This timeline shows a graph from 2007 to 2012 of Latin America & Caribbean . No data until 2006. Number of actual observations by date: 6.
Source name:
World Development Indicators
Source organization:
United Nations Educational, Scientific, and Cultural Organization (UNESCO) Institute for Statistics.
Categories, topics:
Education
Last updated:
apr 23, 2017
Indicators value changes by year
Minimum:
86.595
jan 1, 2012
Maximum:
89.227
jan 1, 2008
At the date of observation
Value
Absolute change
Change from previous value
jan 1, 2007
88.089
+88.089
0.0%
jan 1, 2008
89.227
+1.138
1.29%
jan 1, 2009
88.122
-1.104
-1.24%
jan 1, 2010
88.193
+0.071
0.08%
jan 1, 2011
87.462
-0.731
-0.83%
jan 1, 2012
86.595
-0.867
-0.99%
Ranking of countries by current statistics by years


Comments: