29
/
en
AIzaSyAYiBZKx7MnpbEhh9jyipgxe19OcubqV5w
April 1, 2024
178082
Lesotho
LSO
true
2
1
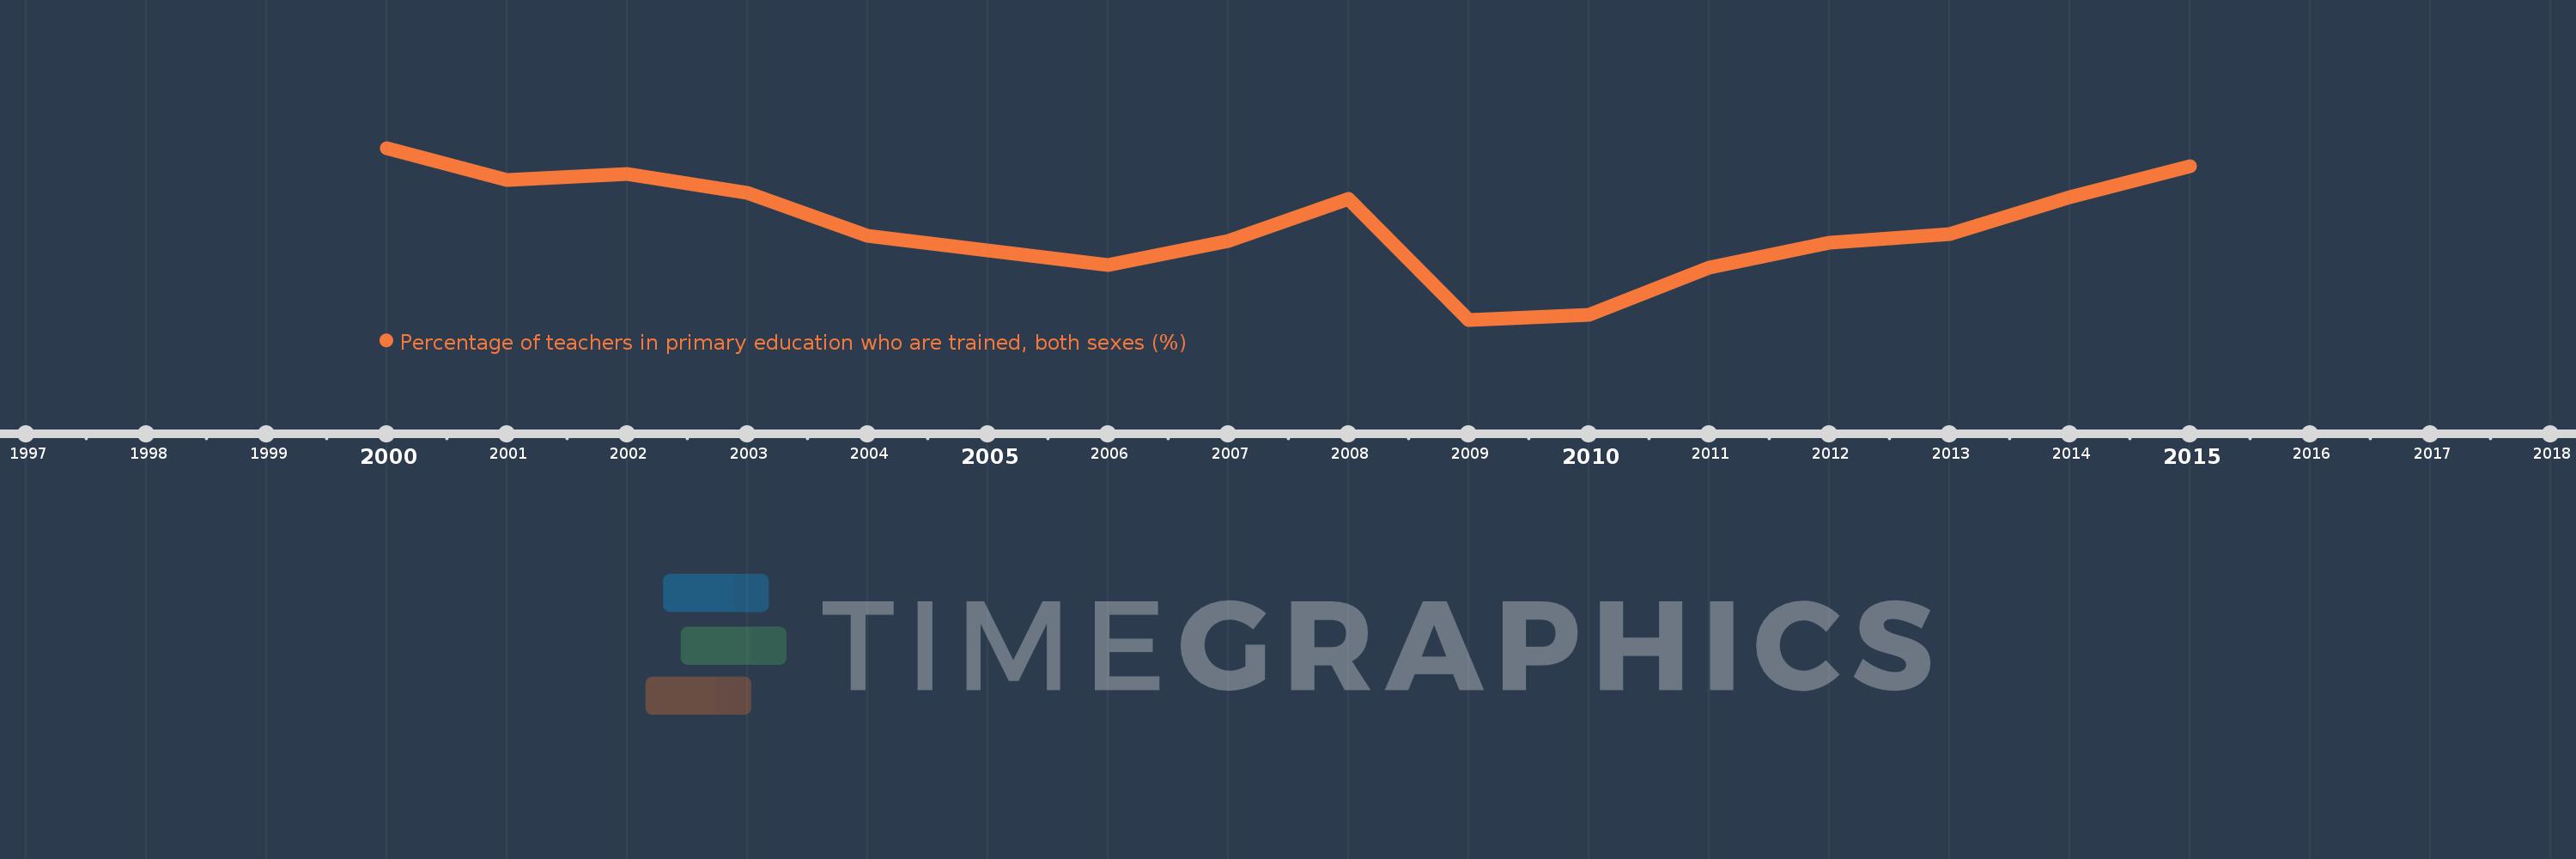
Percentage of teachers in primary education who are trained, both sexes (%)
2015,2014,2013,2012,2011,2010,2009,2008,2007,2006,2005,2004,2003,2002,2001,2000
This statistics in other country:
Timeline:
This timeline shows a graph from 2000 to 2015 of Lesotho. No data until 1999. Number of actual observations by date: 16.
Source name:
World Development Indicators
Source organization:
United Nations Educational, Scientific, and Cultural Organization (UNESCO) Institute for Statistics.
Categories, topics:
Education
Last updated:
apr 23, 2017
Indicators value changes by year
Minimum:
57.021
jan 1, 2009
Maximum:
78.067
jan 1, 2000
At the date of observation
Value
Absolute change
Change from previous value
jan 1, 2000
78.067
+78.067
0.0%
jan 1, 2001
74.19
-3.877
-4.97%
jan 1, 2002
74.846
+0.656
0.88%
jan 1, 2003
72.586
-2.259
-3.02%
jan 1, 2004
67.334
-5.253
-7.24%
jan 1, 2005
65.476
-1.858
-2.76%
jan 1, 2006
63.679
-1.796
-2.74%
jan 1, 2007
66.702
+3.023
4.75%
jan 1, 2008
71.813
+5.111
7.66%
jan 1, 2009
57.021
-14.791
-20.6%
jan 1, 2010
57.602
+0.581
1.02%
jan 1, 2011
63.382
+5.78
10.03%
jan 1, 2012
66.453
+3.071
4.84%
jan 1, 2013
67.545
+1.092
1.64%
jan 1, 2014
72.033
+4.488
6.64%
jan 1, 2015
75.786
+3.753
5.21%
Ranking of countries by current statistics by years


Comments: