29
/
en
AIzaSyAYiBZKx7MnpbEhh9jyipgxe19OcubqV5w
April 1, 2024
140864
Ghana
GHA
true
2
1
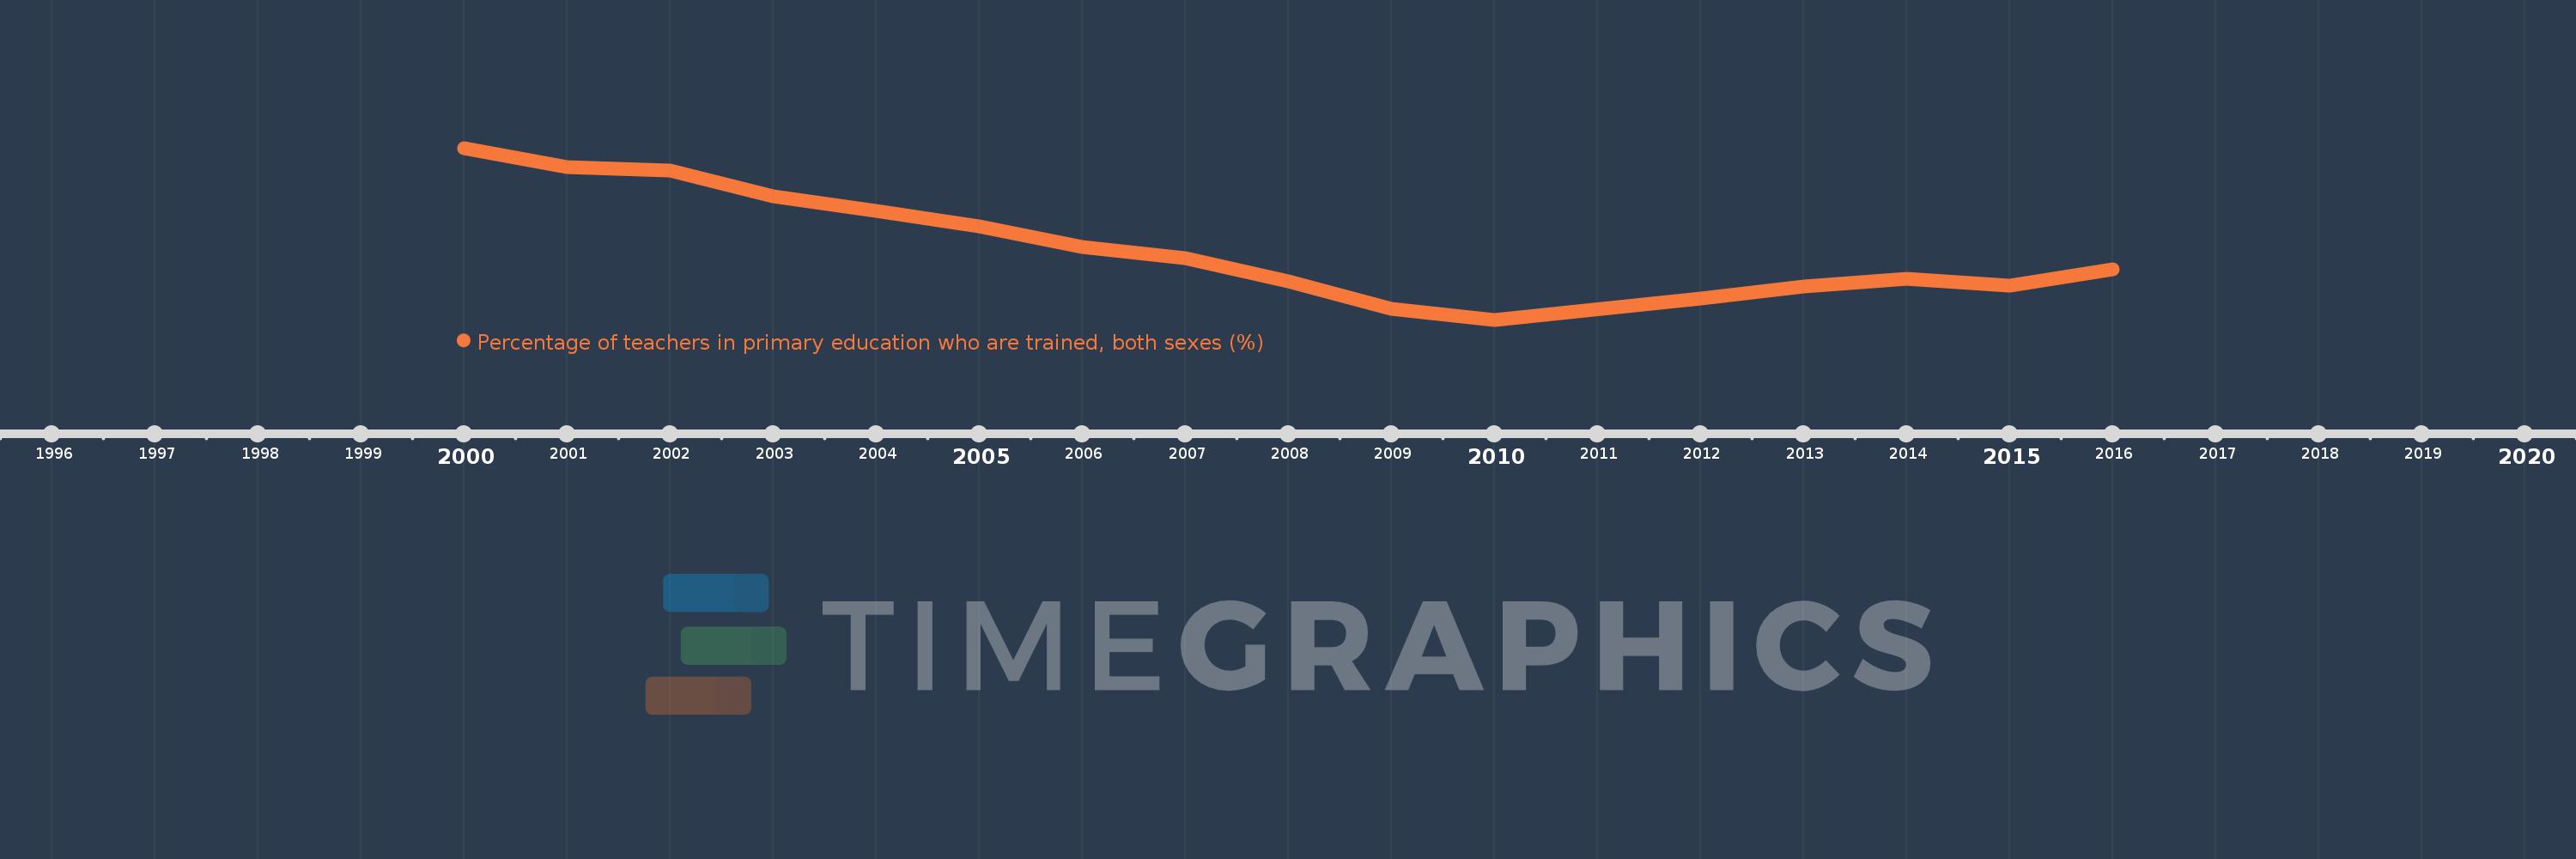
Percentage of teachers in primary education who are trained, both sexes (%)
2016,2015,2014,2013,2012,2010,2009,2008,2007,2006,2005,2004,2003,2002,2001,2000
This statistics in other country:
Timeline:
This timeline shows a graph from 2000 to 2016 of Ghana. No data until 1999. Number of actual observations by date: 16.
Source name:
World Development Indicators
Source organization:
United Nations Educational, Scientific, and Cultural Organization (UNESCO) Institute for Statistics.
Categories, topics:
Education
Last updated:
apr 23, 2017
Indicators value changes by year
Minimum:
47.567
jan 1, 2010
Maximum:
71.796
jan 1, 2000
At the date of observation
Value
Absolute change
Change from previous value
jan 1, 2000
71.796
+71.796
0.0%
jan 1, 2001
69.093
-2.703
-3.76%
jan 1, 2002
68.612
-0.481
-0.7%
jan 1, 2003
64.944
-3.668
-5.35%
jan 1, 2004
62.88
-2.064
-3.18%
jan 1, 2005
60.714
-2.167
-3.45%
jan 1, 2006
57.875
-2.838
-4.67%
jan 1, 2007
56.304
-1.571
-2.72%
jan 1, 2008
53.011
-3.293
-5.85%
jan 1, 2009
49.071
-3.94
-7.43%
jan 1, 2010
47.567
-1.504
-3.07%
jan 1, 2012
50.6
+3.034
6.38%
jan 1, 2013
52.266
+1.666
3.29%
jan 1, 2014
53.304
+1.039
1.99%
jan 1, 2015
52.398
-0.907
-1.7%
jan 1, 2016
54.695
+2.297
4.38%
Ranking of countries by current statistics by years


Comments: