29
/
en
AIzaSyAYiBZKx7MnpbEhh9jyipgxe19OcubqV5w
April 1, 2024
186980
Malawi
MWI
true
2
1
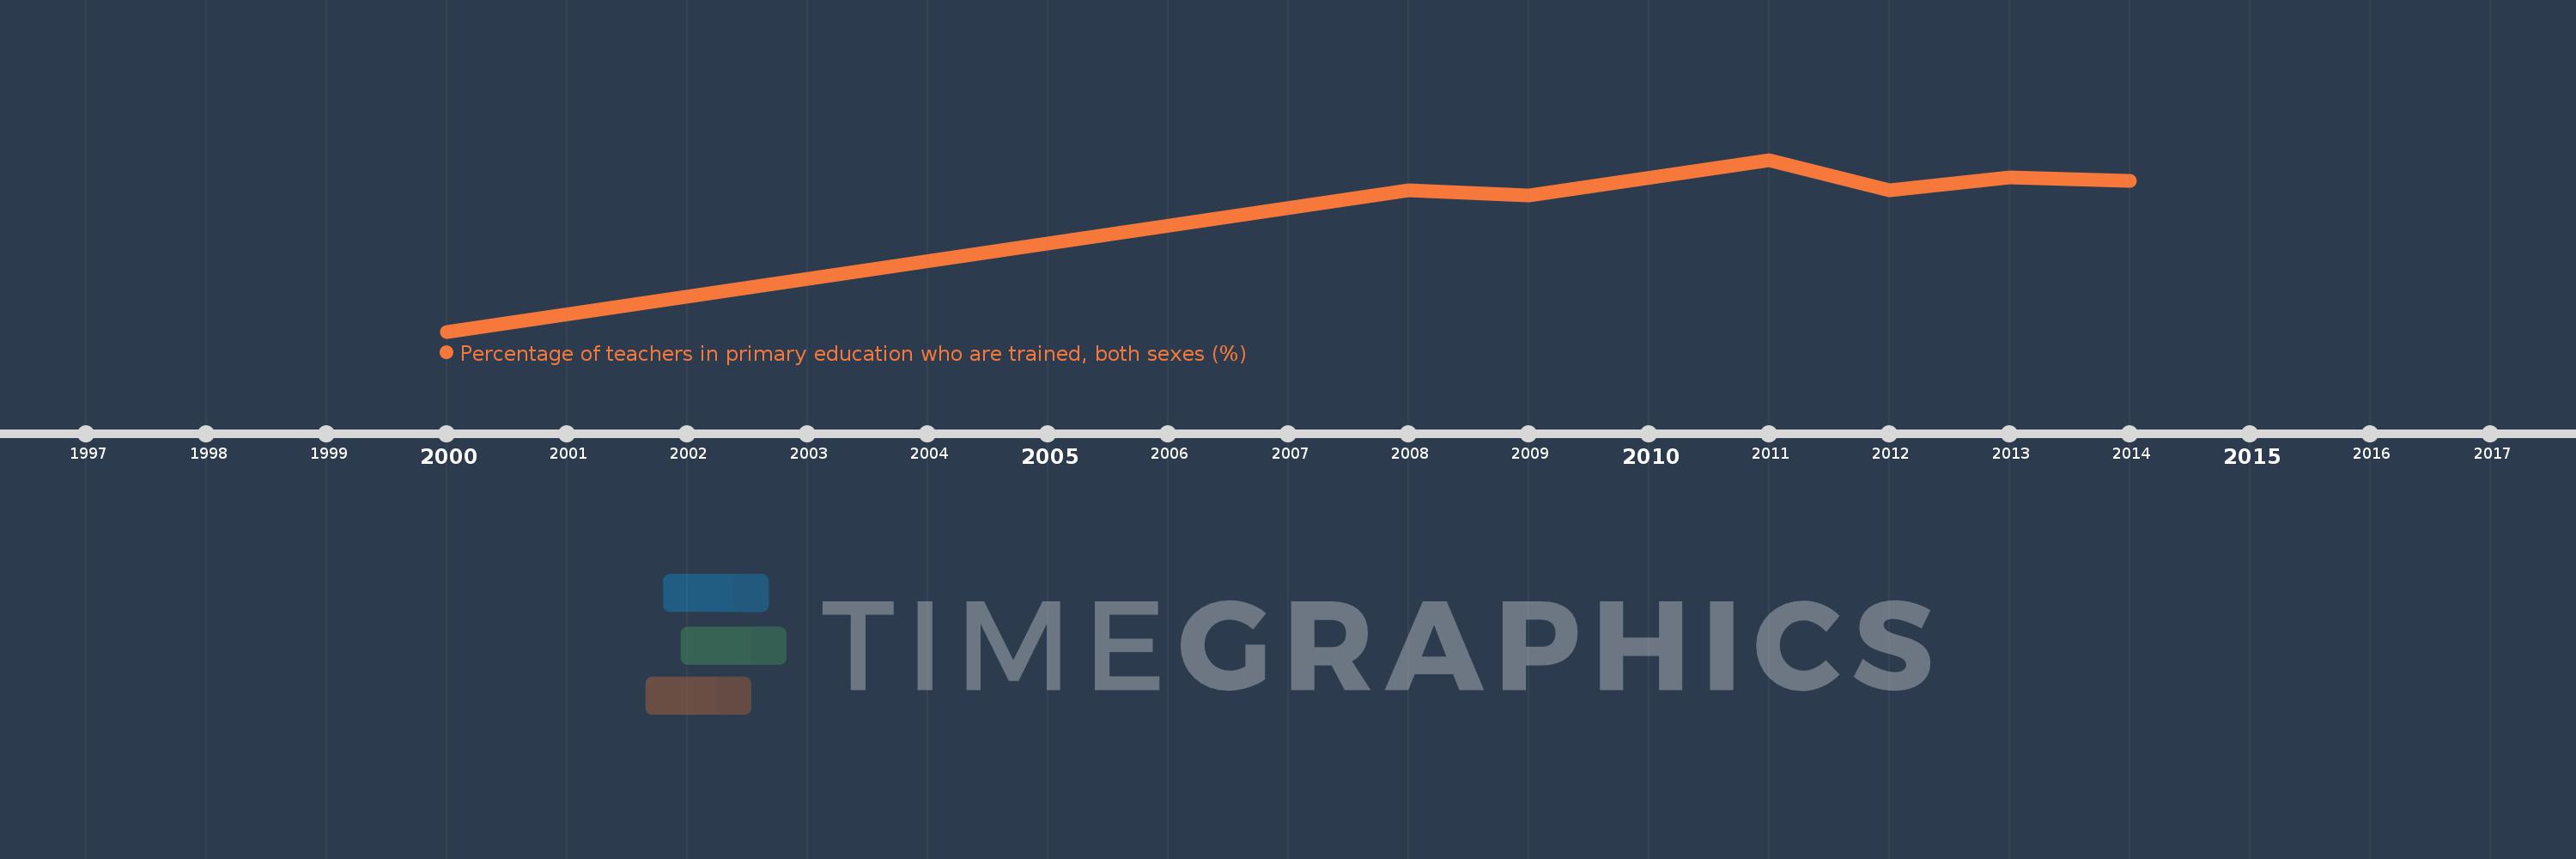
Percentage of teachers in primary education who are trained, both sexes (%)
2014,2013,2012,2011,2009,2008,2000
This statistics in other country:
Timeline:
This timeline shows a graph from 2000 to 2014 of Malawi. No data until 1999. Number of actual observations by date: 7.
Source name:
World Development Indicators
Source organization:
United Nations Educational, Scientific, and Cultural Organization (UNESCO) Institute for Statistics.
Categories, topics:
Education
Last updated:
apr 23, 2017
Indicators value changes by year
Minimum:
53.543
jan 1, 2000
Maximum:
95.913
jan 1, 2011
At the date of observation
Value
Absolute change
Change from previous value
jan 1, 2000
53.543
+53.543
0.0%
jan 1, 2008
88.382
+34.839
65.07%
jan 1, 2009
87.172
-1.21
-1.37%
jan 1, 2011
95.913
+8.74
10.03%
jan 1, 2012
88.447
-7.466
-7.78%
jan 1, 2013
91.628
+3.182
3.6%
jan 1, 2014
90.81
-0.818
-0.89%
Ranking of countries by current statistics by years


Comments: