29
/
en
AIzaSyAYiBZKx7MnpbEhh9jyipgxe19OcubqV5w
April 1, 2024
252285
St. Vincent and the Grenadines
VCT
true
2
1
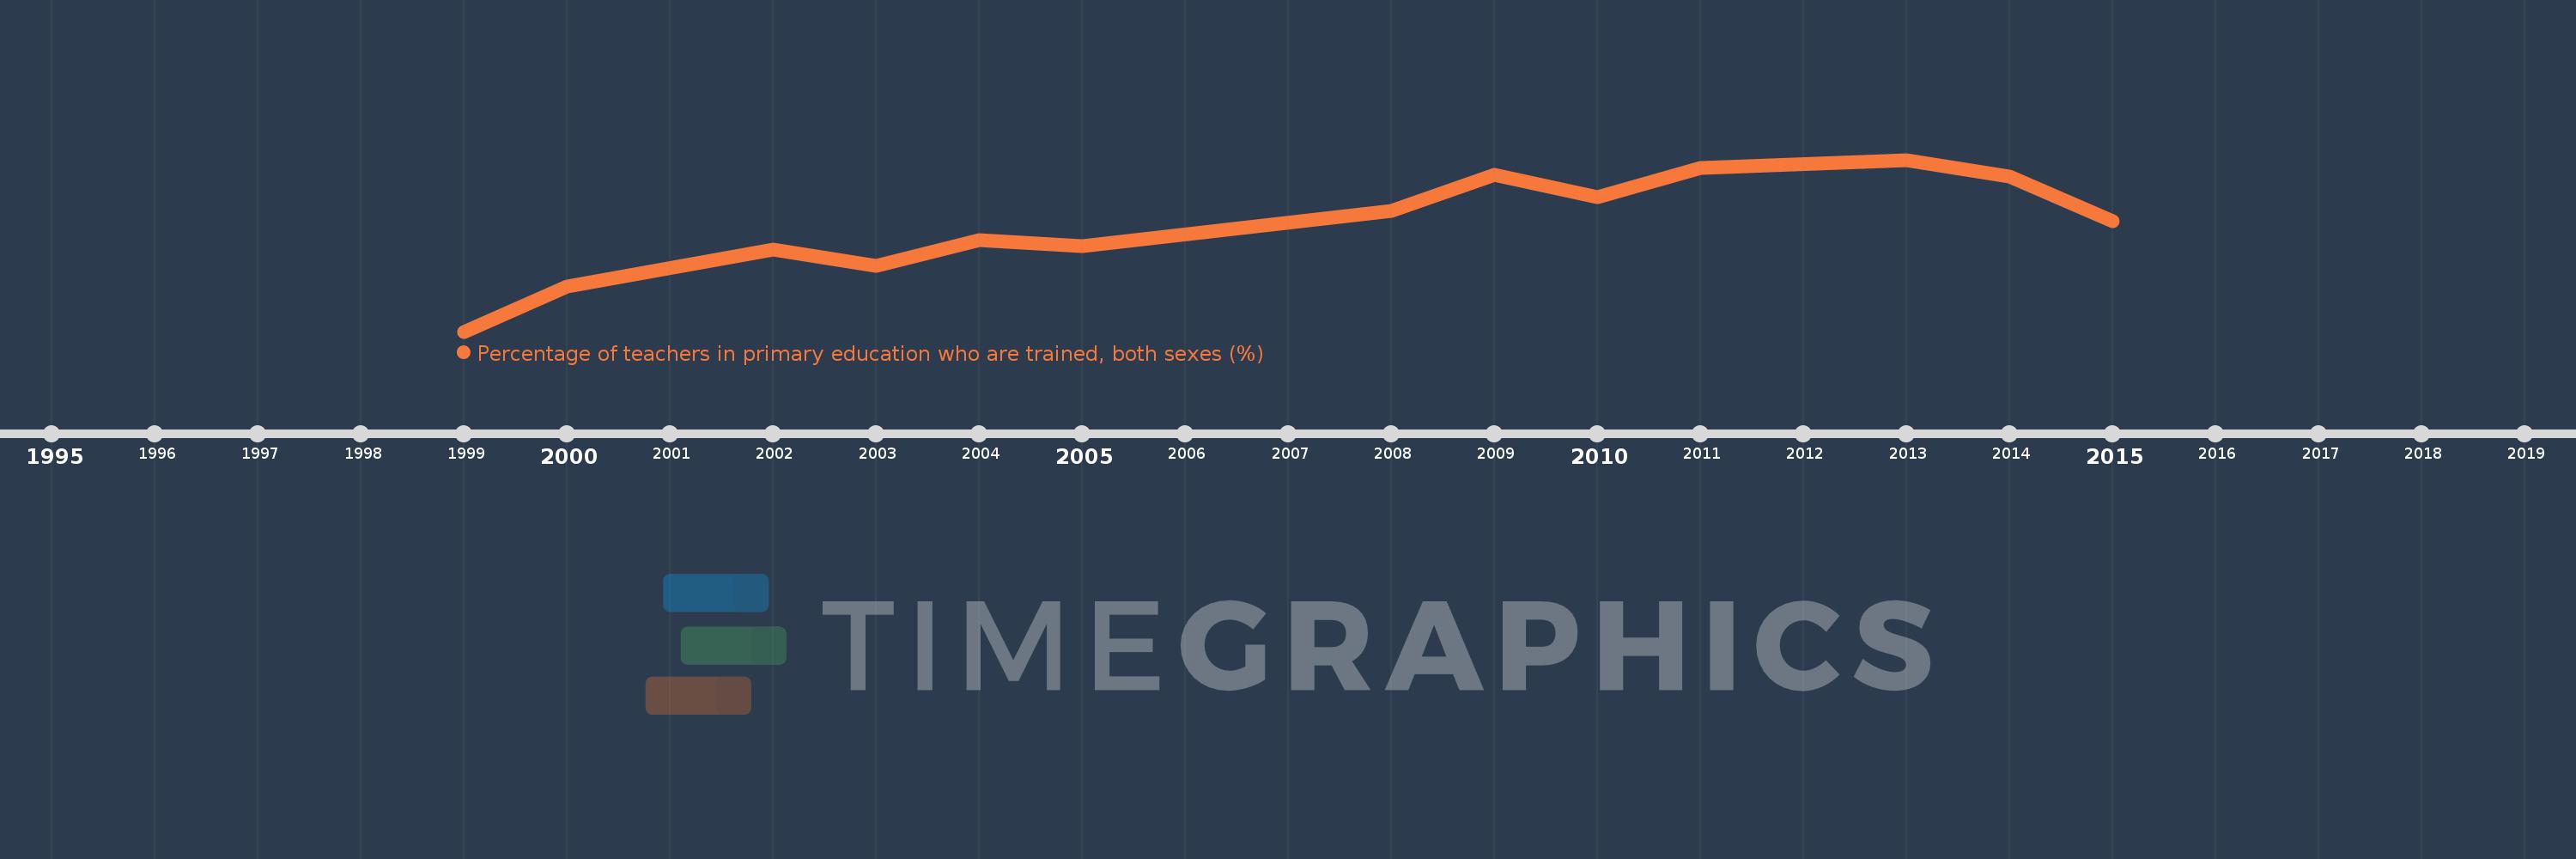
Percentage of teachers in primary education who are trained, both sexes (%)
2015,2014,2013,2011,2010,2009,2008,2005,2004,2003,2002,2000,1999
This statistics in other country:
Timeline:
This timeline shows a graph from 1999 to 2015 of St. Vincent and the Grenadines. No data until 1998. Number of actual observations by date: 13.
Source name:
World Development Indicators
Source organization:
United Nations Educational, Scientific, and Cultural Organization (UNESCO) Institute for Statistics.
Categories, topics:
Education
Last updated:
apr 23, 2017
Indicators value changes by year
Minimum:
59.285
jan 1, 1999
Maximum:
85.291
jan 1, 2013
At the date of observation
Value
Absolute change
Change from previous value
jan 1, 1999
59.285
+59.285
0.0%
jan 1, 2000
66.135
+6.85
11.56%
jan 1, 2002
71.713
+5.578
8.43%
jan 1, 2003
69.209
-2.504
-3.49%
jan 1, 2004
73.139
+3.93
5.68%
jan 1, 2005
72.2
-0.938
-1.28%
jan 1, 2008
77.599
+5.399
7.48%
jan 1, 2009
82.969
+5.37
6.92%
jan 1, 2010
79.636
-3.333
-4.02%
jan 1, 2011
84.104
+4.468
5.61%
jan 1, 2013
85.291
+1.187
1.41%
jan 1, 2014
82.697
-2.594
-3.04%
jan 1, 2015
76.051
-6.645
-8.04%
Ranking of countries by current statistics by years


Comments: