29
/
en
AIzaSyAYiBZKx7MnpbEhh9jyipgxe19OcubqV5w
April 1, 2024
100375
Cameroon
CMR
true
2
1
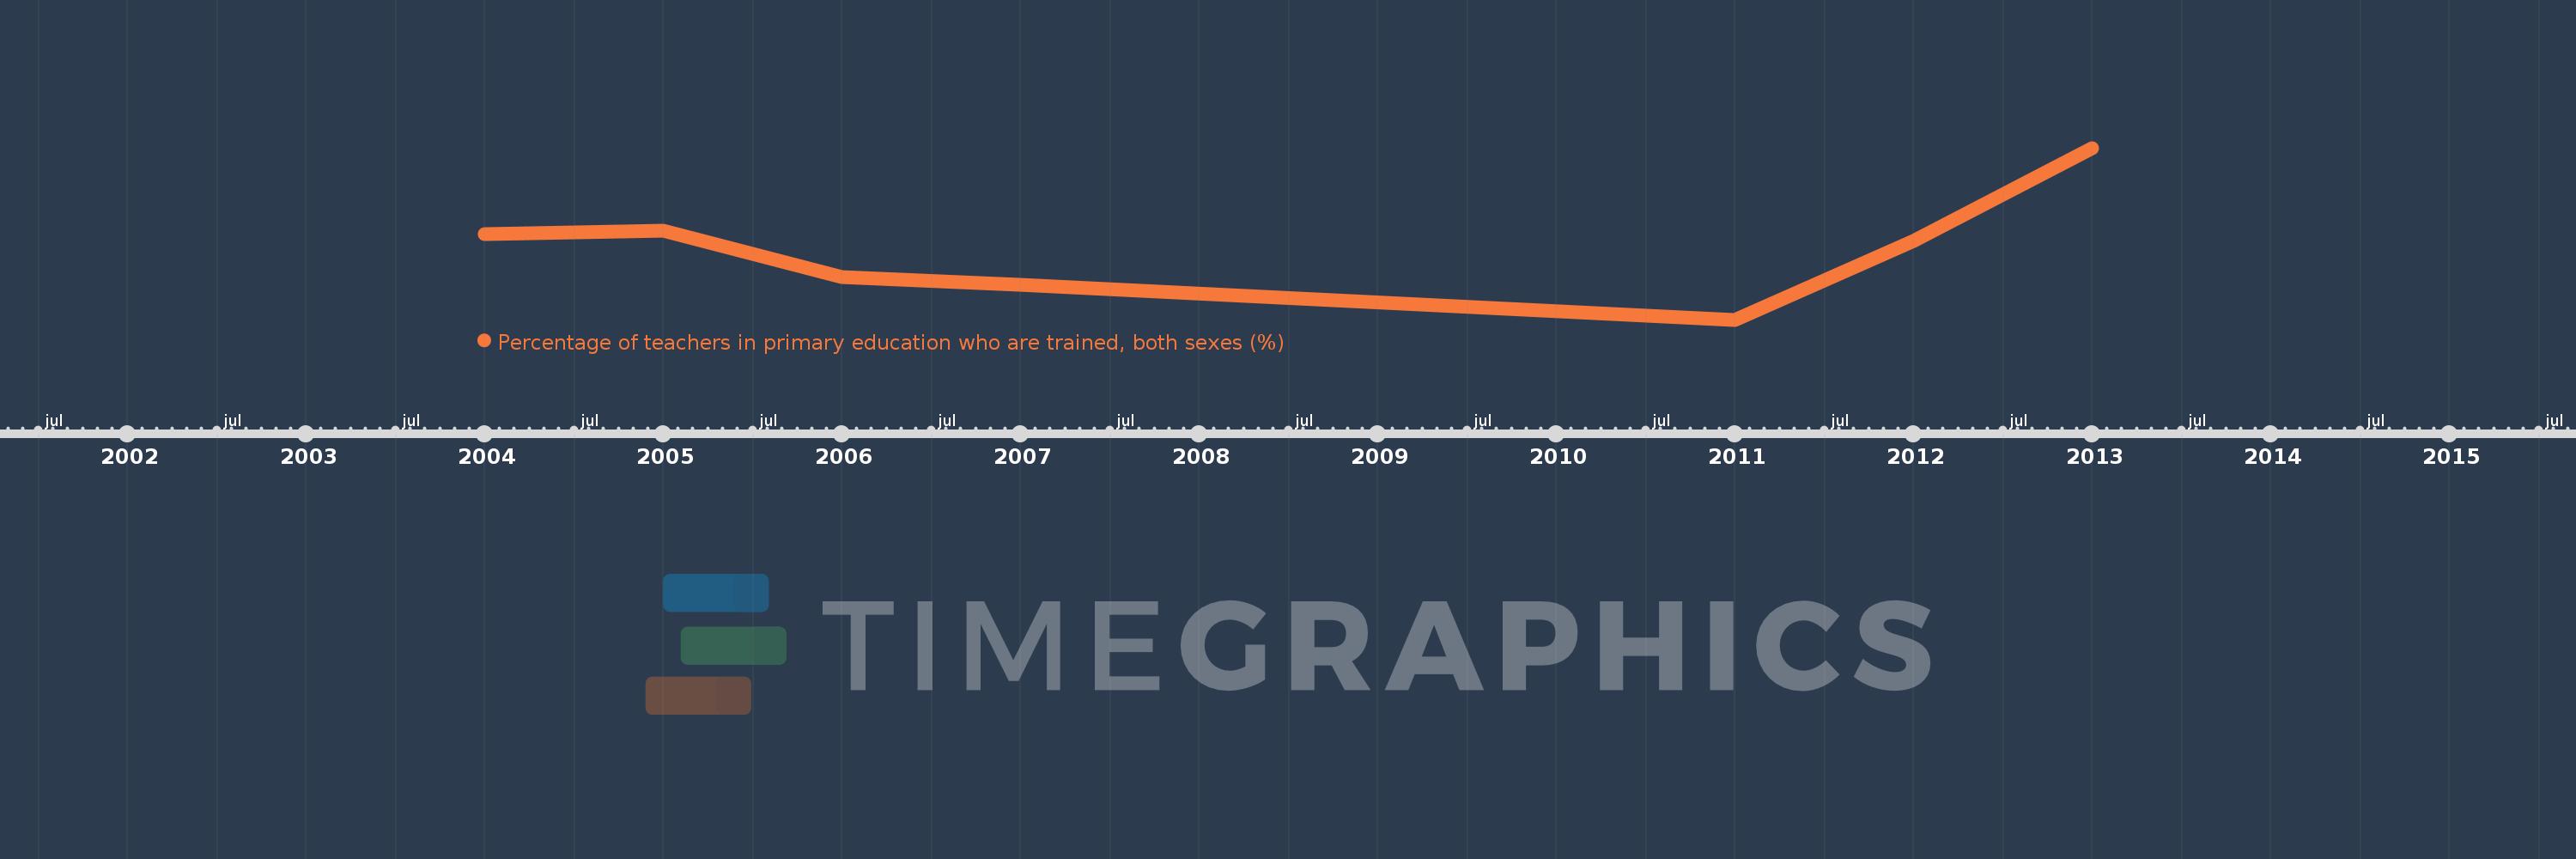
Percentage of teachers in primary education who are trained, both sexes (%)
2013,2012,2011,2007,2006,2005,2004
This statistics in other country:
Timeline:
This timeline shows a graph from 2004 to 2013 of Cameroon. No data until 2003. Number of actual observations by date: 7.
Source name:
World Development Indicators
Source organization:
United Nations Educational, Scientific, and Cultural Organization (UNESCO) Institute for Statistics.
Categories, topics:
Education
Last updated:
apr 23, 2017
Indicators value changes by year
Minimum:
57.394
jan 1, 2011
Maximum:
78.778
jan 1, 2013
At the date of observation
Value
Absolute change
Change from previous value
jan 1, 2004
68.058
+68.058
0.0%
jan 1, 2005
68.534
+0.476
0.7%
jan 1, 2006
62.741
-5.793
-8.45%
jan 1, 2007
61.77
-0.971
-1.55%
jan 1, 2011
57.394
-4.377
-7.09%
jan 1, 2012
67.15
+9.756
17.0%
jan 1, 2013
78.778
+11.628
17.32%
Ranking of countries by current statistics by years


Comments: