29
/
en
AIzaSyAYiBZKx7MnpbEhh9jyipgxe19OcubqV5w
April 1, 2024
56532
Small states
SST
false
2
1
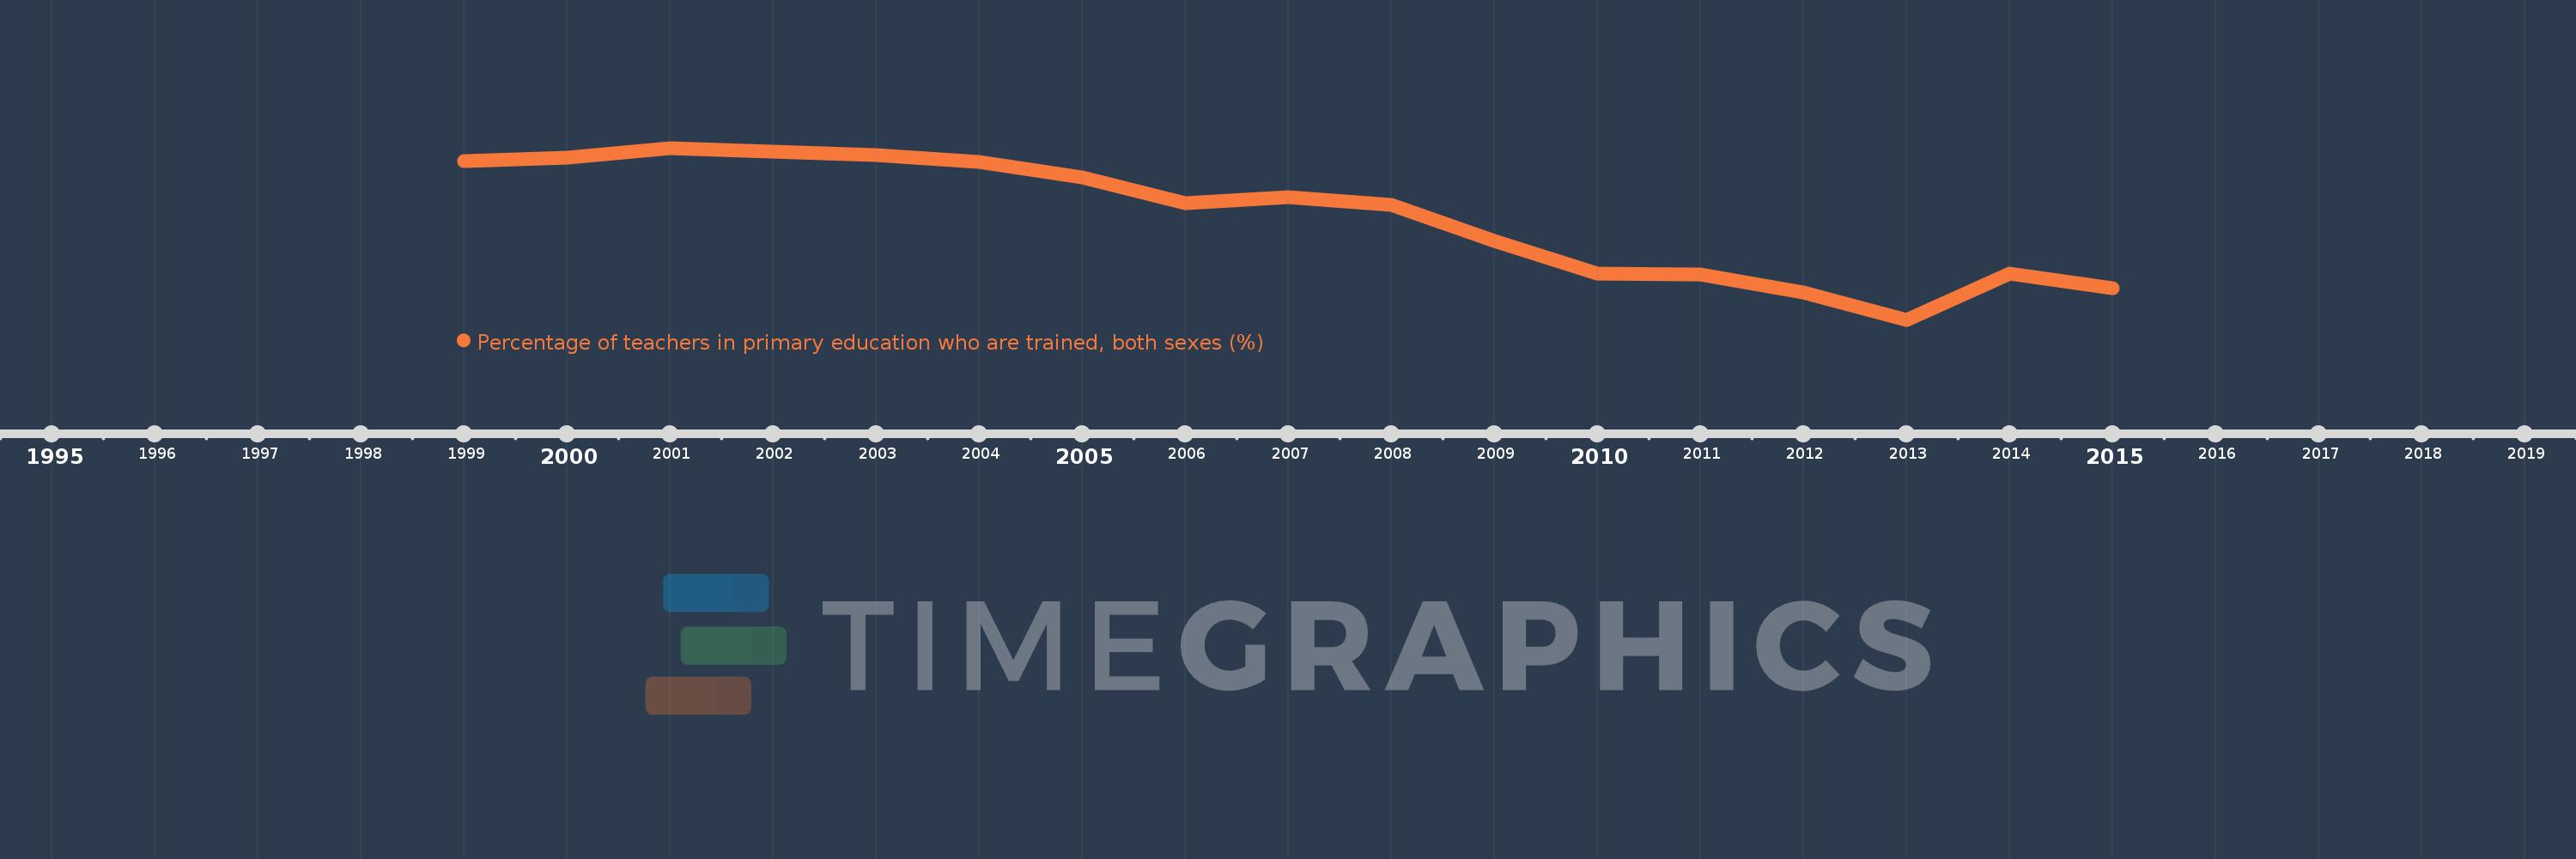
Percentage of teachers in primary education who are trained, both sexes (%)
2015,2014,2013,2012,2011,2010,2009,2008,2007,2006,2005,2004,2003,2002,2001,2000,1999
This statistics in other country:
Timeline:
This timeline shows a graph from 1999 to 2015 of Small states. No data until 1998. Number of actual observations by date: 17.
Source name:
World Development Indicators
Source organization:
United Nations Educational, Scientific, and Cultural Organization (UNESCO) Institute for Statistics.
Categories, topics:
Education
Last updated:
apr 23, 2017
Indicators value changes by year
Minimum:
77.937
jan 1, 2013
At the date of observation
Value
Absolute change
Change from previous value
jan 1, 1999
83.048
+83.048
0.0%
jan 1, 2000
83.169
+0.121
0.15%
jan 1, 2001
83.47
+0.301
0.36%
jan 1, 2002
83.353
-0.118
-0.14%
jan 1, 2003
83.246
-0.107
-0.13%
jan 1, 2004
83.022
-0.224
-0.27%
jan 1, 2005
82.518
-0.504
-0.61%
jan 1, 2006
81.68
-0.839
-1.02%
jan 1, 2007
81.878
+0.198
0.24%
jan 1, 2008
81.647
-0.231
-0.28%
jan 1, 2009
80.472
-1.175
-1.44%
jan 1, 2010
79.433
-1.039
-1.29%
jan 1, 2011
79.403
-0.03
-0.04%
jan 1, 2012
78.816
-0.586
-0.74%
jan 1, 2013
77.937
-0.879
-1.12%
jan 1, 2014
79.411
+1.474
1.89%
jan 1, 2015
78.954
-0.457
-0.57%
Ranking of countries by current statistics by years


Comments: