29
/
en
AIzaSyAYiBZKx7MnpbEhh9jyipgxe19OcubqV5w
April 1, 2024
146108
Guinea
GIN
true
2
1
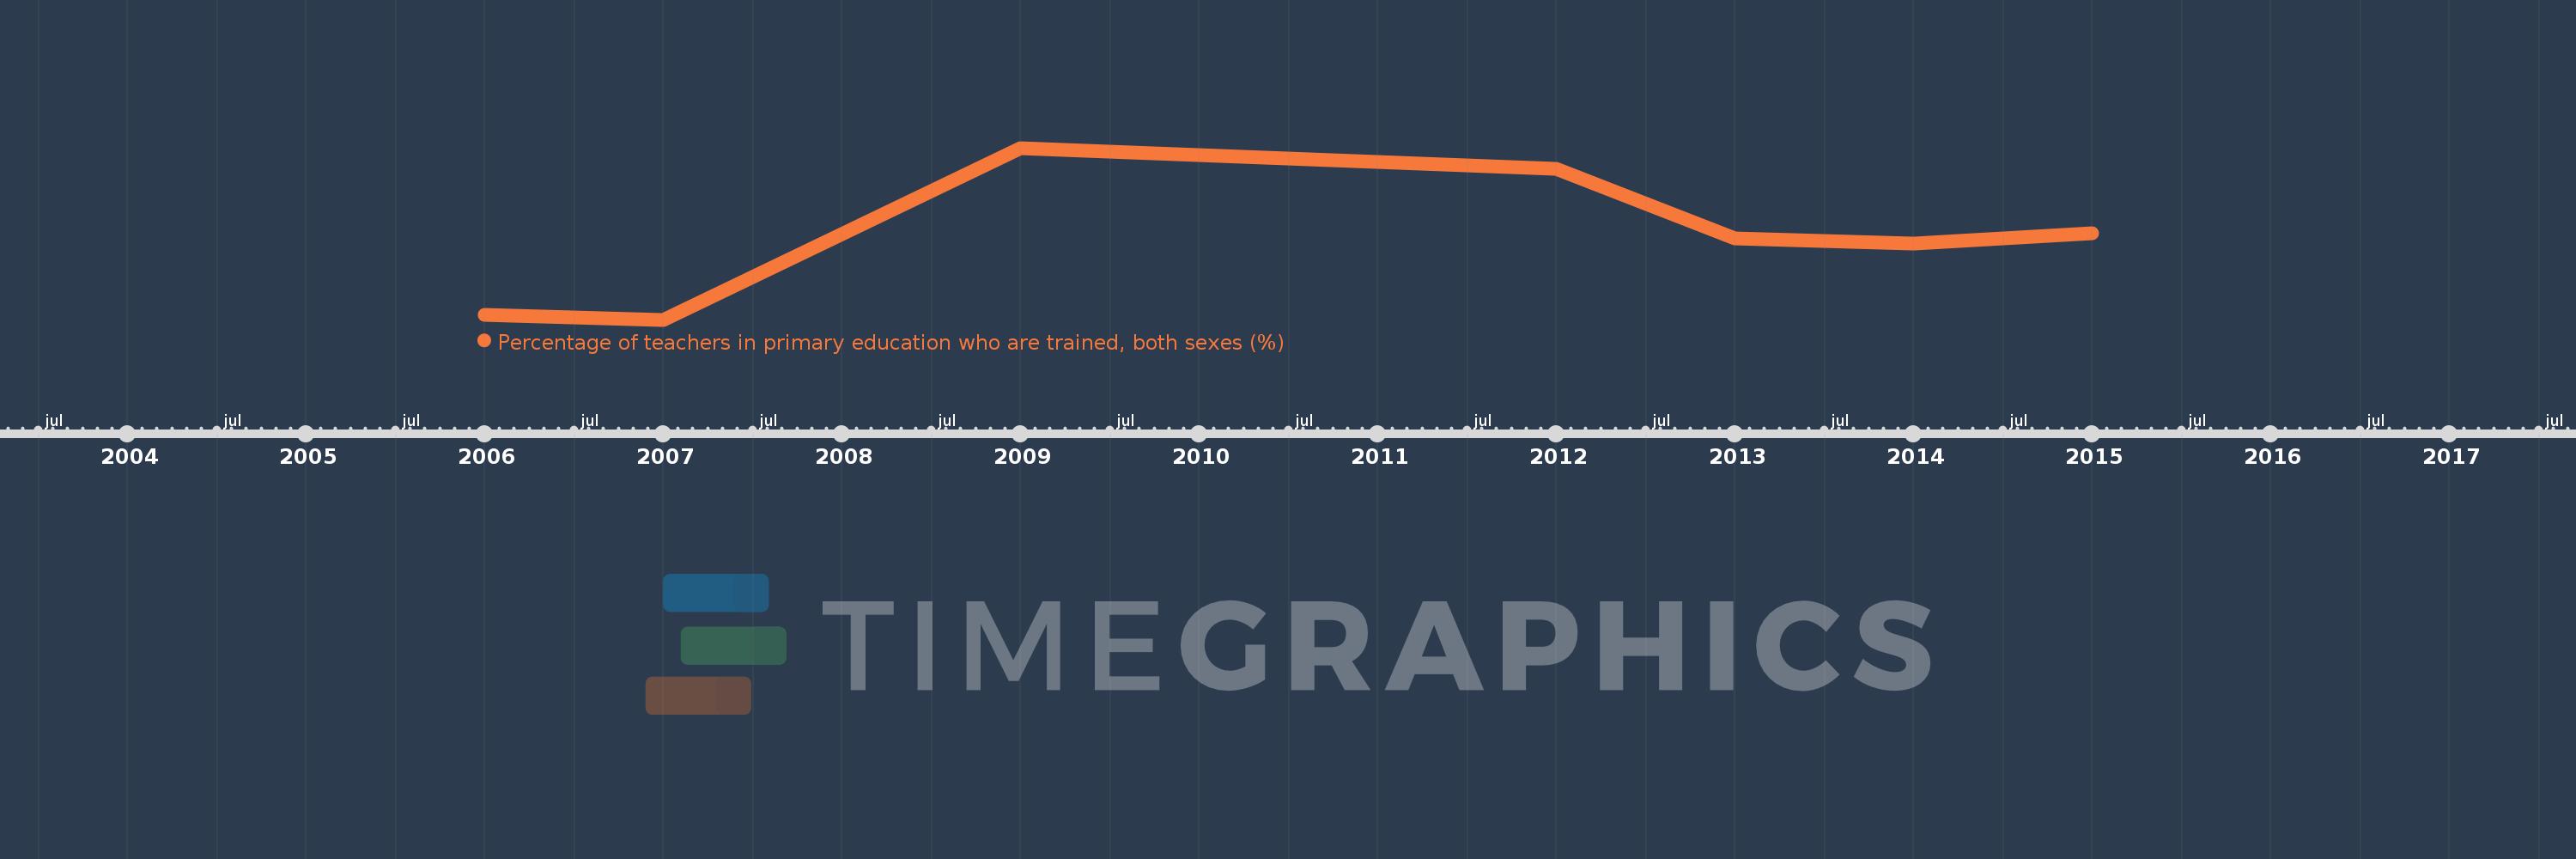
Percentage of teachers in primary education who are trained, both sexes (%)
2015,2014,2013,2012,2009,2007,2006
This statistics in other country:
Timeline:
This timeline shows a graph from 2006 to 2015 of Guinea. No data until 2005. Number of actual observations by date: 7.
Source name:
World Development Indicators
Source organization:
United Nations Educational, Scientific, and Cultural Organization (UNESCO) Institute for Statistics.
Categories, topics:
Education
Last updated:
apr 23, 2017
Indicators value changes by year
Minimum:
67.695
jan 1, 2007
Maximum:
82.145
jan 1, 2009
At the date of observation
Value
Absolute change
Change from previous value
jan 1, 2006
68.082
+68.082
0.0%
jan 1, 2007
67.695
-0.387
-0.57%
jan 1, 2009
82.145
+14.45
21.35%
jan 1, 2012
80.376
-1.769
-2.15%
jan 1, 2013
74.515
-5.862
-7.29%
jan 1, 2014
74.118
-0.396
-0.53%
jan 1, 2015
75.004
+0.886
1.19%
Ranking of countries by current statistics by years


Comments: