29
/
en
AIzaSyAYiBZKx7MnpbEhh9jyipgxe19OcubqV5w
April 1, 2024
267266
Trinidad and Tobago
TTO
true
2
1
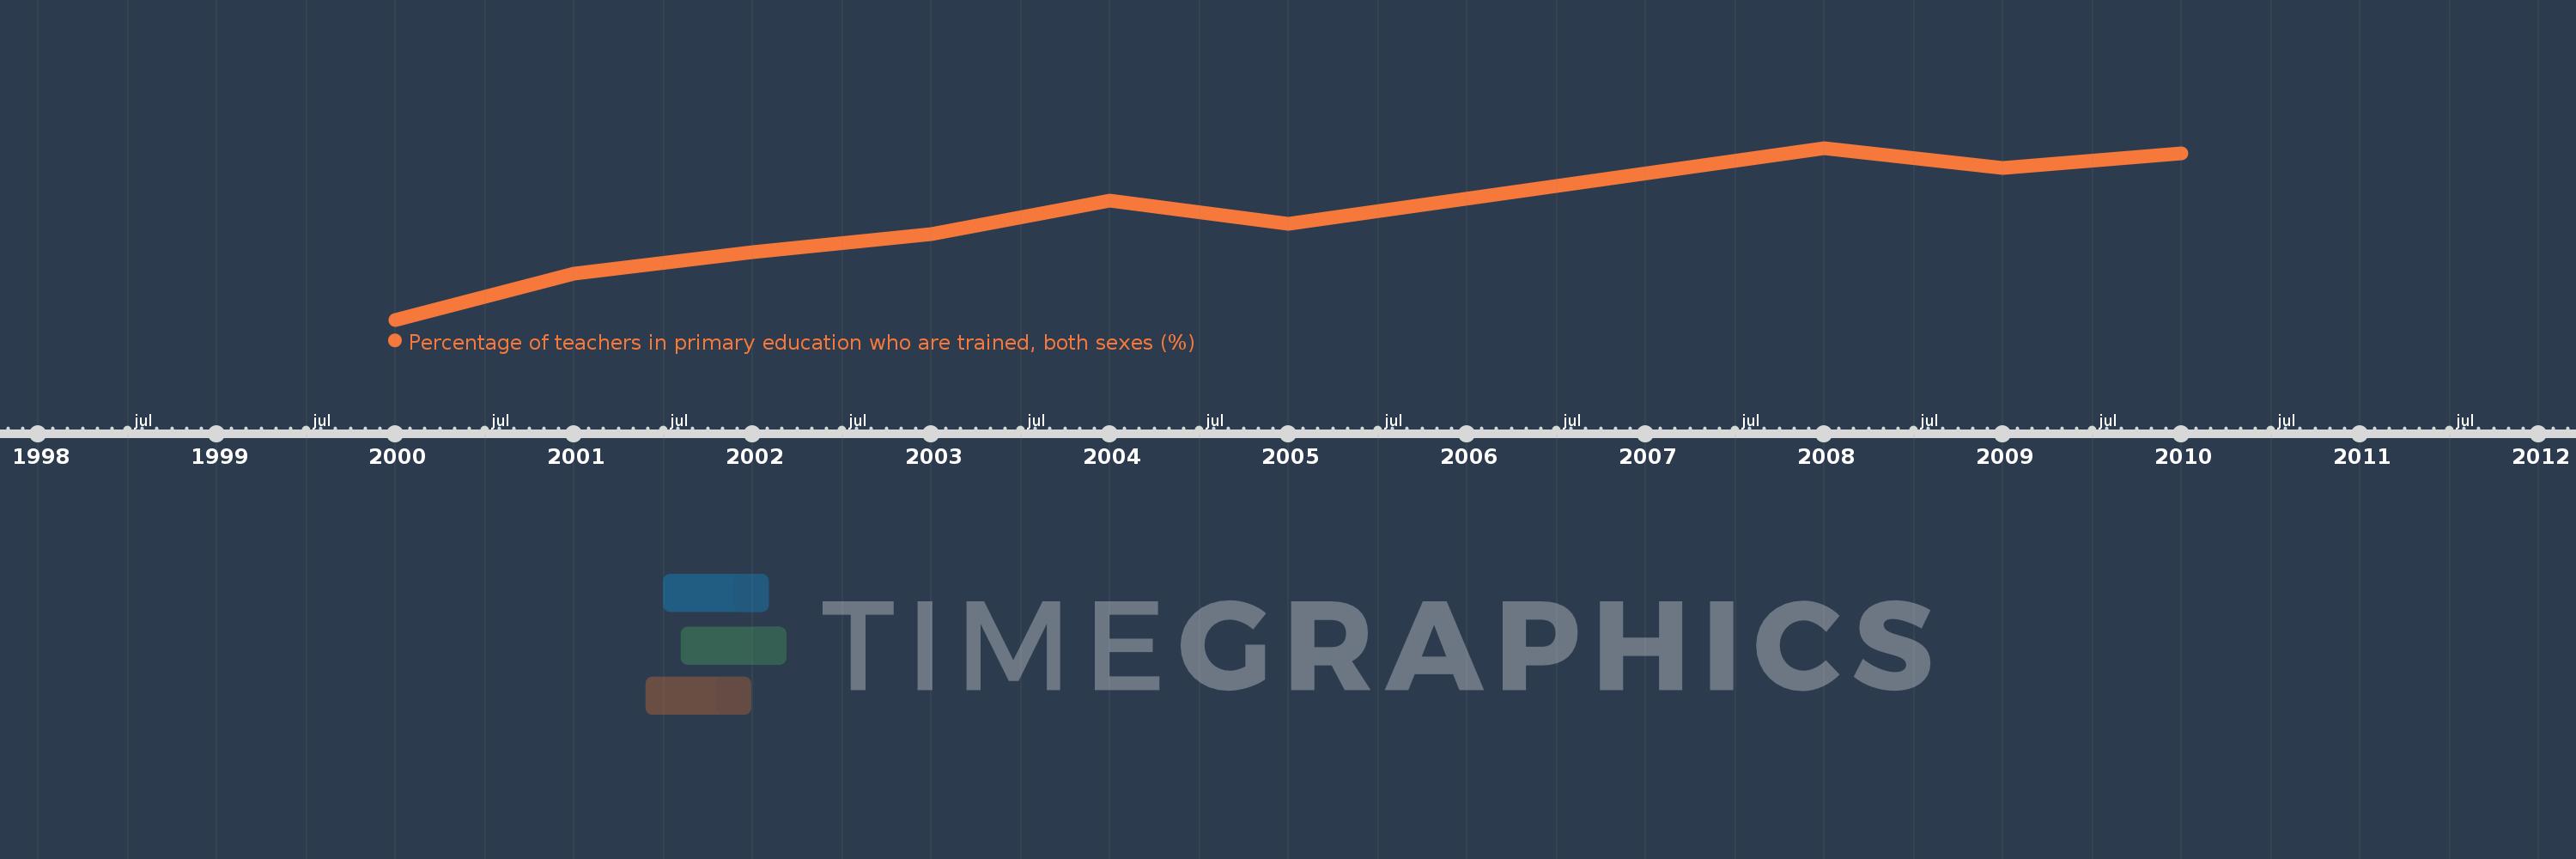
Percentage of teachers in primary education who are trained, both sexes (%)
2010,2009,2008,2005,2004,2003,2002,2001,2000
This statistics in other country:
Timeline:
This timeline shows a graph from 2000 to 2010 of Trinidad and Tobago. No data until 1999. Number of actual observations by date: 9.
Source name:
World Development Indicators
Source organization:
United Nations Educational, Scientific, and Cultural Organization (UNESCO) Institute for Statistics.
Categories, topics:
Education
Last updated:
apr 23, 2017
Indicators value changes by year
Minimum:
71.452
jan 1, 2000
Maximum:
88.557
jan 1, 2008
At the date of observation
Value
Absolute change
Change from previous value
jan 1, 2000
71.452
+71.452
0.0%
jan 1, 2001
76.077
+4.626
6.47%
jan 1, 2002
78.146
+2.069
2.72%
jan 1, 2003
79.958
+1.812
2.32%
jan 1, 2004
83.301
+3.342
4.18%
jan 1, 2005
81.005
-2.295
-2.76%
jan 1, 2008
88.557
+7.552
9.32%
jan 1, 2009
86.589
-1.968
-2.22%
jan 1, 2010
87.995
+1.406
1.62%
Ranking of countries by current statistics by years


Comments: