29
/
en
AIzaSyAYiBZKx7MnpbEhh9jyipgxe19OcubqV5w
April 1, 2024
207225
Nepal
NPL
true
2
1
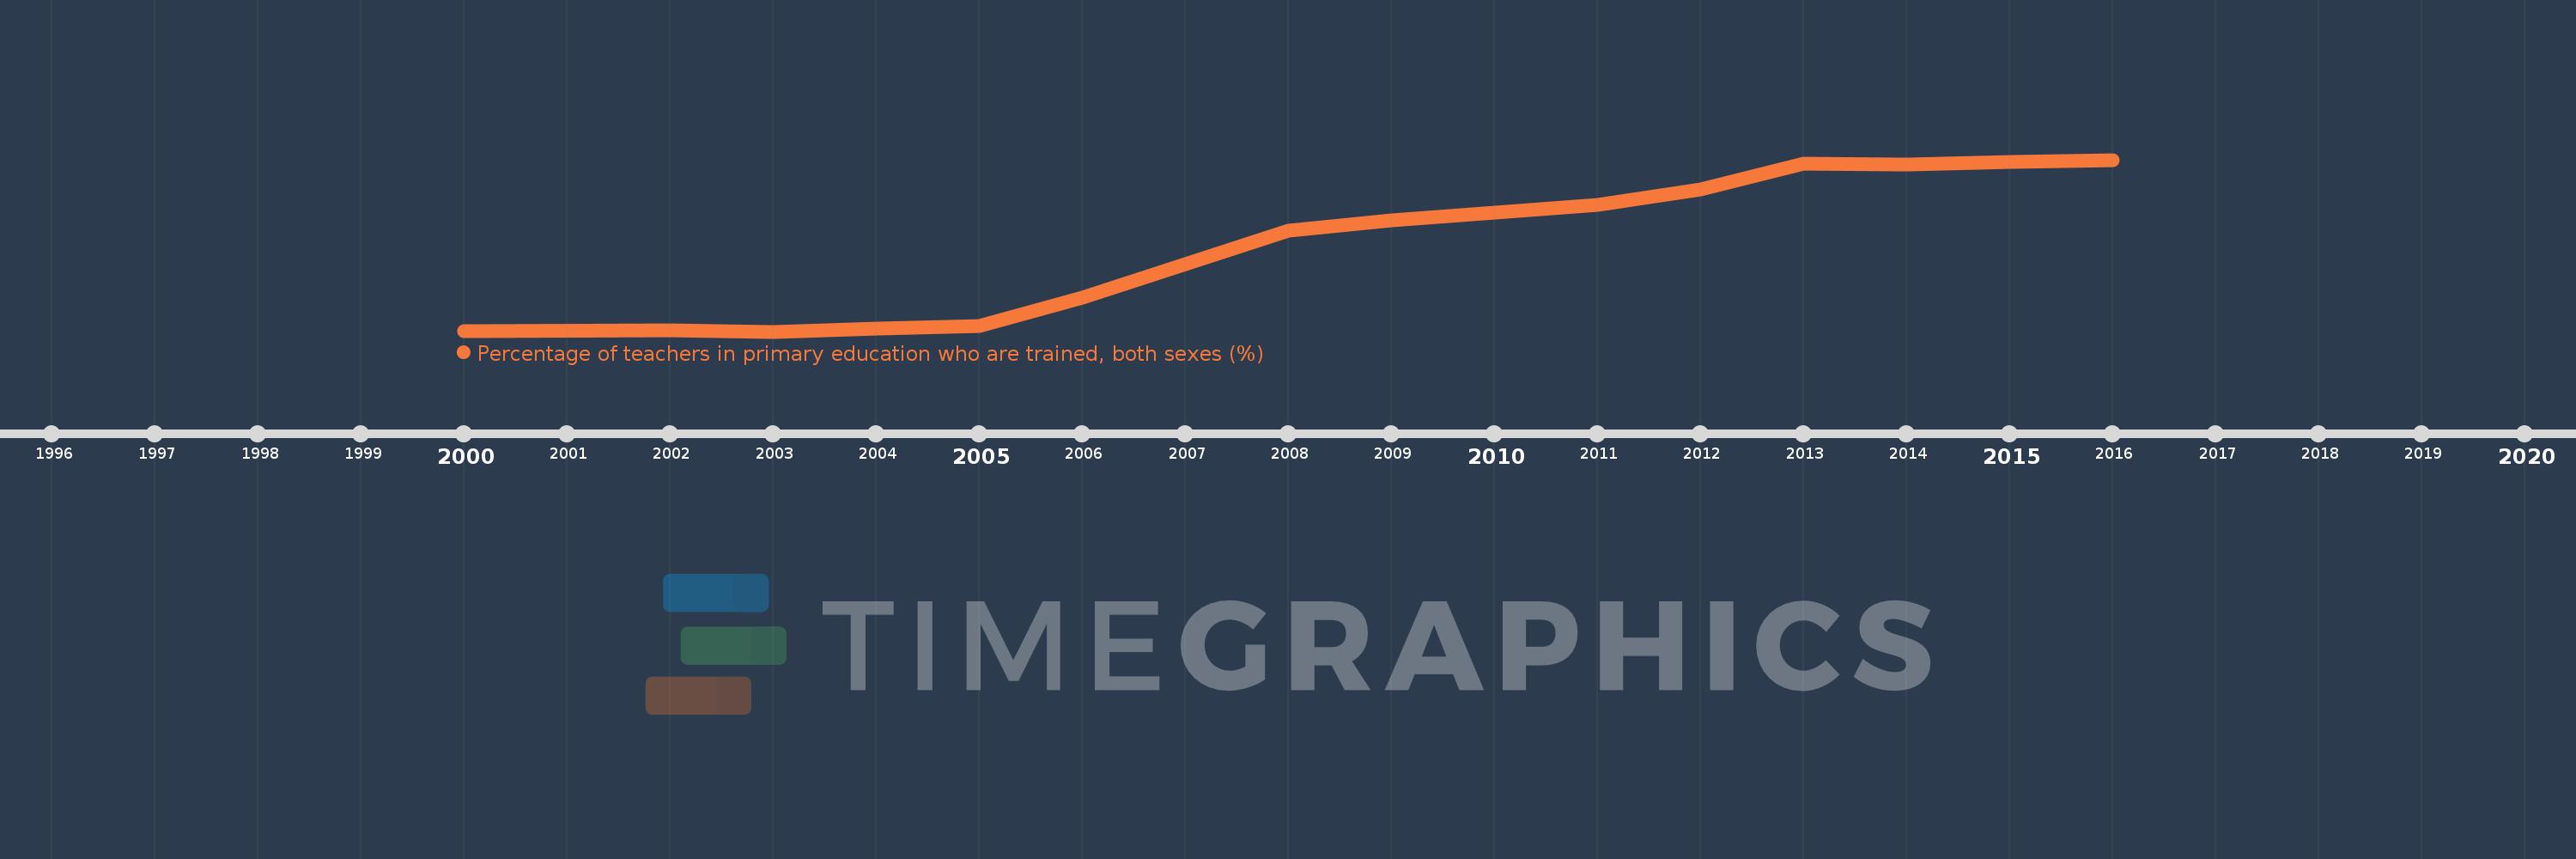
Percentage of teachers in primary education who are trained, both sexes (%)
2016,2015,2014,2013,2012,2011,2009,2008,2006,2005,2004,2003,2002,2000
This statistics in other country:
Timeline:
This timeline shows a graph from 2000 to 2016 of Nepal. No data until 1999. Number of actual observations by date: 14.
Source name:
World Development Indicators
Source organization:
United Nations Educational, Scientific, and Cultural Organization (UNESCO) Institute for Statistics.
Categories, topics:
Education
Last updated:
apr 23, 2017
Indicators value changes by year
Minimum:
14.682
jan 1, 2003
Maximum:
94.423
jan 1, 2016
At the date of observation
Value
Absolute change
Change from previous value
jan 1, 2000
15.0
+15.0
0.0%
jan 1, 2002
15.371
+0.371
2.47%
jan 1, 2003
14.682
-0.69
-4.49%
jan 1, 2004
16.227
+1.546
10.53%
jan 1, 2005
17.386
+1.159
7.14%
jan 1, 2006
30.514
+13.128
75.51%
jan 1, 2008
61.36
+30.846
101.09%
jan 1, 2009
66.436
+5.076
8.27%
jan 1, 2011
73.661
+7.225
10.87%
jan 1, 2012
80.729
+7.068
9.59%
jan 1, 2013
92.559
+11.831
14.65%
jan 1, 2014
92.185
-0.374
-0.4%
jan 1, 2015
93.582
+1.396
1.51%
jan 1, 2016
94.423
+0.842
0.9%
Ranking of countries by current statistics by years


Comments: