29
/
en
AIzaSyAYiBZKx7MnpbEhh9jyipgxe19OcubqV5w
April 1, 2024
54345
Pacific island small states
PSS
false
2
1
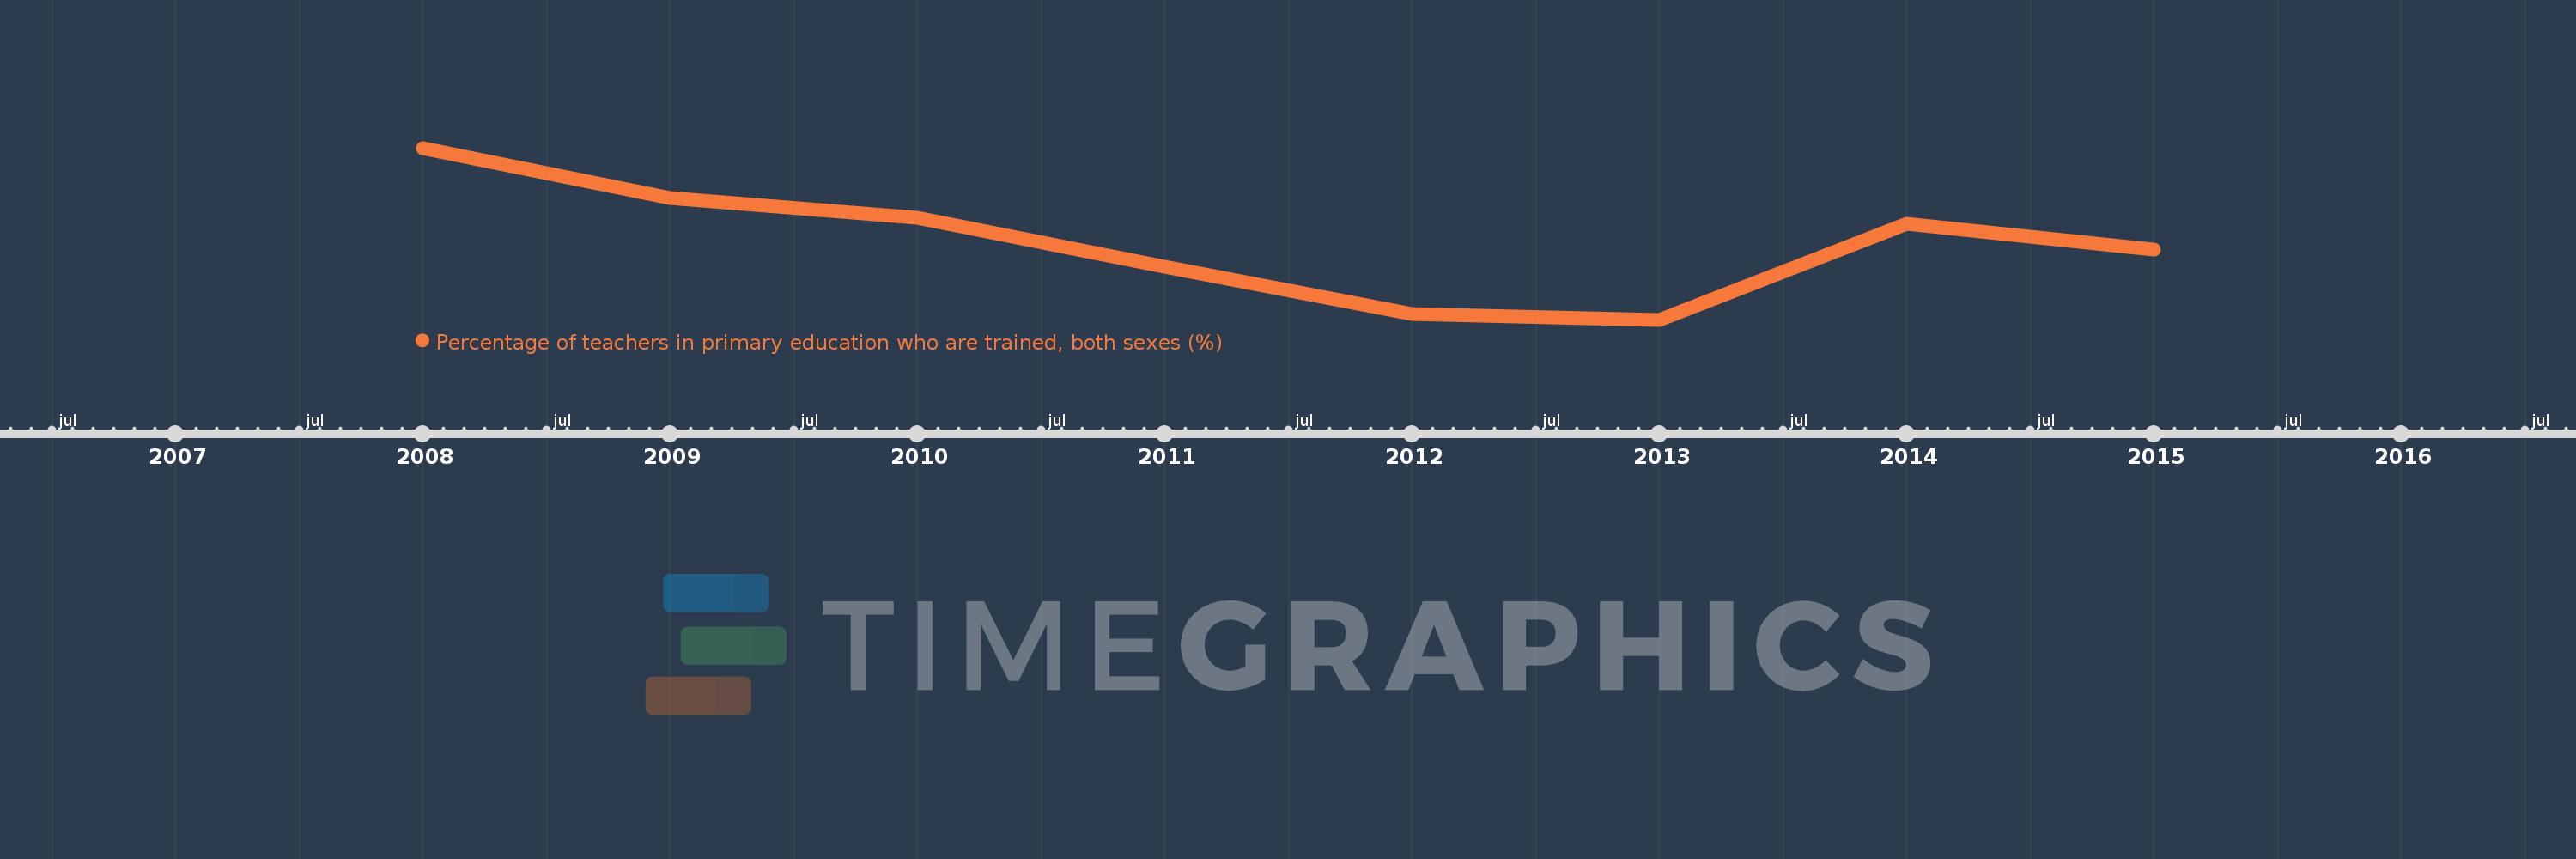
Percentage of teachers in primary education who are trained, both sexes (%)
2015,2014,2013,2012,2011,2010,2009,2008
This statistics in other country:
Timeline:
This timeline shows a graph from 2008 to 2015 of Pacific island small states. No data until 2007. Number of actual observations by date: 8.
Source name:
World Development Indicators
Source organization:
United Nations Educational, Scientific, and Cultural Organization (UNESCO) Institute for Statistics.
Categories, topics:
Education
Last updated:
apr 23, 2017
Indicators value changes by year
Minimum:
78.577
jan 1, 2013
At the date of observation
Value
Absolute change
Change from previous value
jan 1, 2008
86.02
+86.02
0.0%
jan 1, 2009
83.864
-2.156
-2.51%
jan 1, 2010
82.987
-0.877
-1.05%
jan 1, 2011
80.869
-2.118
-2.55%
jan 1, 2012
78.841
-2.028
-2.51%
jan 1, 2013
78.577
-0.265
-0.34%
jan 1, 2014
82.724
+4.147
5.28%
jan 1, 2015
81.6
-1.124
-1.36%
Ranking of countries by current statistics by years


Comments: