29
/
en
AIzaSyAYiBZKx7MnpbEhh9jyipgxe19OcubqV5w
April 1, 2024
34515
Fragile and conflict affected situations
FCS
false
2
1
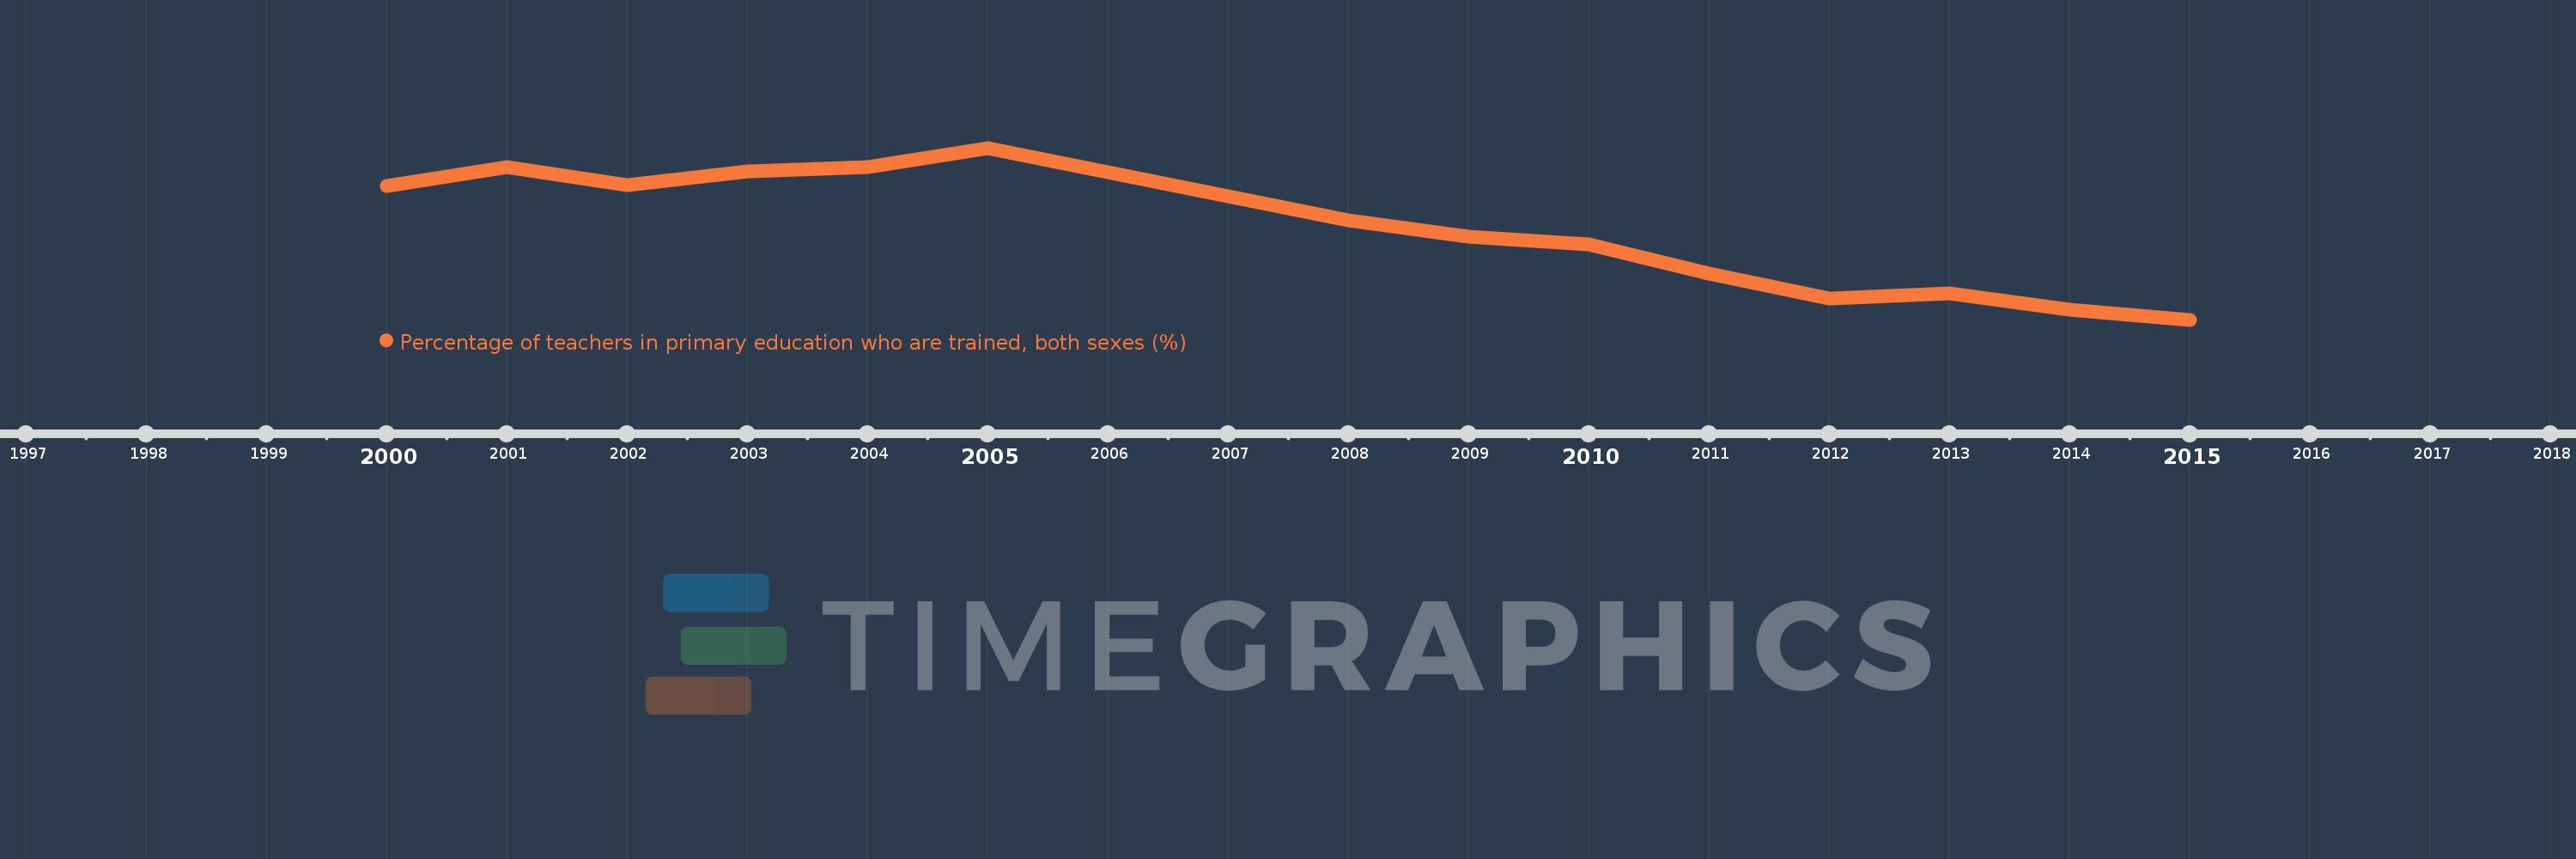
Percentage of teachers in primary education who are trained, both sexes (%)
2015,2014,2013,2012,2011,2010,2009,2008,2005,2004,2003,2002,2001,2000
This statistics in other country:
Timeline:
This timeline shows a graph from 2000 to 2015 of Fragile and conflict affected situations. No data until 1999. Number of actual observations by date: 14.
Source name:
World Development Indicators
Source organization:
United Nations Educational, Scientific, and Cultural Organization (UNESCO) Institute for Statistics.
Categories, topics:
Education
Last updated:
apr 23, 2017
Indicators value changes by year
Minimum:
77.373
jan 1, 2015
Maximum:
86.305
jan 1, 2005
At the date of observation
Value
Absolute change
Change from previous value
jan 1, 2000
84.307
+84.307
0.0%
jan 1, 2001
85.307
+1.0
1.19%
jan 1, 2002
84.373
-0.934
-1.09%
jan 1, 2003
85.088
+0.714
0.85%
jan 1, 2004
85.317
+0.23
0.27%
jan 1, 2005
86.305
+0.988
1.16%
jan 1, 2008
82.548
-3.758
-4.35%
jan 1, 2009
81.671
-0.877
-1.06%
jan 1, 2010
81.283
-0.388
-0.47%
jan 1, 2011
79.759
-1.524
-1.88%
jan 1, 2012
78.465
-1.294
-1.62%
jan 1, 2013
78.759
+0.294
0.38%
jan 1, 2014
77.882
-0.877
-1.11%
jan 1, 2015
77.373
-0.509
-0.65%
Ranking of countries by current statistics by years


Comments: