29
/
en
AIzaSyAYiBZKx7MnpbEhh9jyipgxe19OcubqV5w
April 1, 2024
128688
Eritrea
ERI
true
2
1
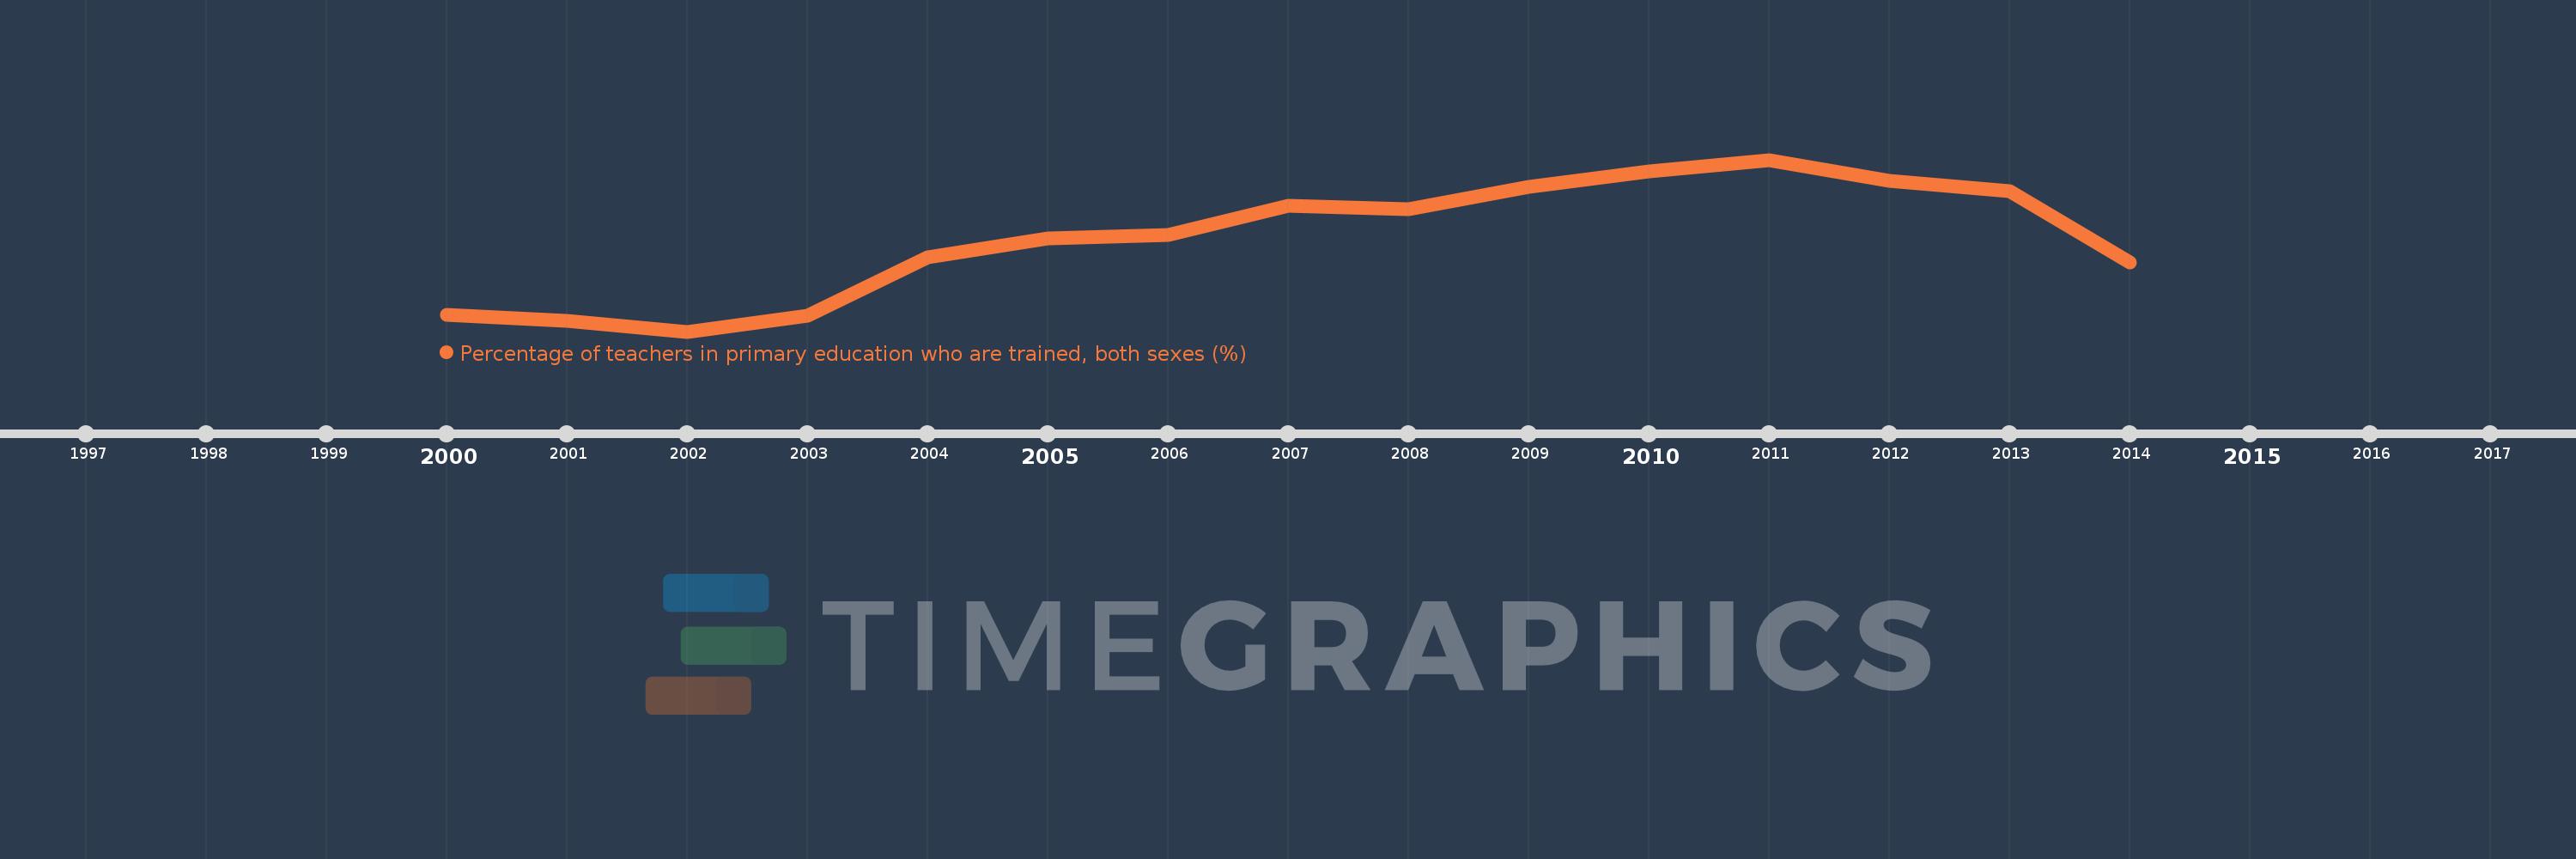
Percentage of teachers in primary education who are trained, both sexes (%)
2014,2013,2012,2011,2010,2009,2008,2007,2006,2005,2004,2003,2002,2001,2000
This statistics in other country:
Timeline:
This timeline shows a graph from 2000 to 2014 of Eritrea. No data until 1999. Number of actual observations by date: 15.
Source name:
World Development Indicators
Source organization:
United Nations Educational, Scientific, and Cultural Organization (UNESCO) Institute for Statistics.
Categories, topics:
Education
Last updated:
apr 23, 2017
Indicators value changes by year
Minimum:
70.471
jan 1, 2002
Maximum:
93.816
jan 1, 2011
At the date of observation
Value
Absolute change
Change from previous value
jan 1, 2000
72.776
+72.776
0.0%
jan 1, 2001
71.97
-0.806
-1.11%
jan 1, 2002
70.471
-1.499
-2.08%
jan 1, 2003
72.619
+2.148
3.05%
jan 1, 2004
80.523
+7.903
10.88%
jan 1, 2005
83.095
+2.572
3.19%
jan 1, 2006
83.606
+0.511
0.62%
jan 1, 2007
87.524
+3.918
4.69%
jan 1, 2008
87.105
-0.419
-0.48%
jan 1, 2009
90.193
+3.088
3.54%
jan 1, 2010
92.246
+2.053
2.28%
jan 1, 2011
93.816
+1.57
1.7%
jan 1, 2012
90.979
-2.837
-3.02%
jan 1, 2013
89.554
-1.424
-1.57%
jan 1, 2014
79.862
-9.693
-10.82%
Ranking of countries by current statistics by years


Comments: