29
/
en
AIzaSyAYiBZKx7MnpbEhh9jyipgxe19OcubqV5w
April 1, 2024
86376
Bhutan
BTN
true
2
1
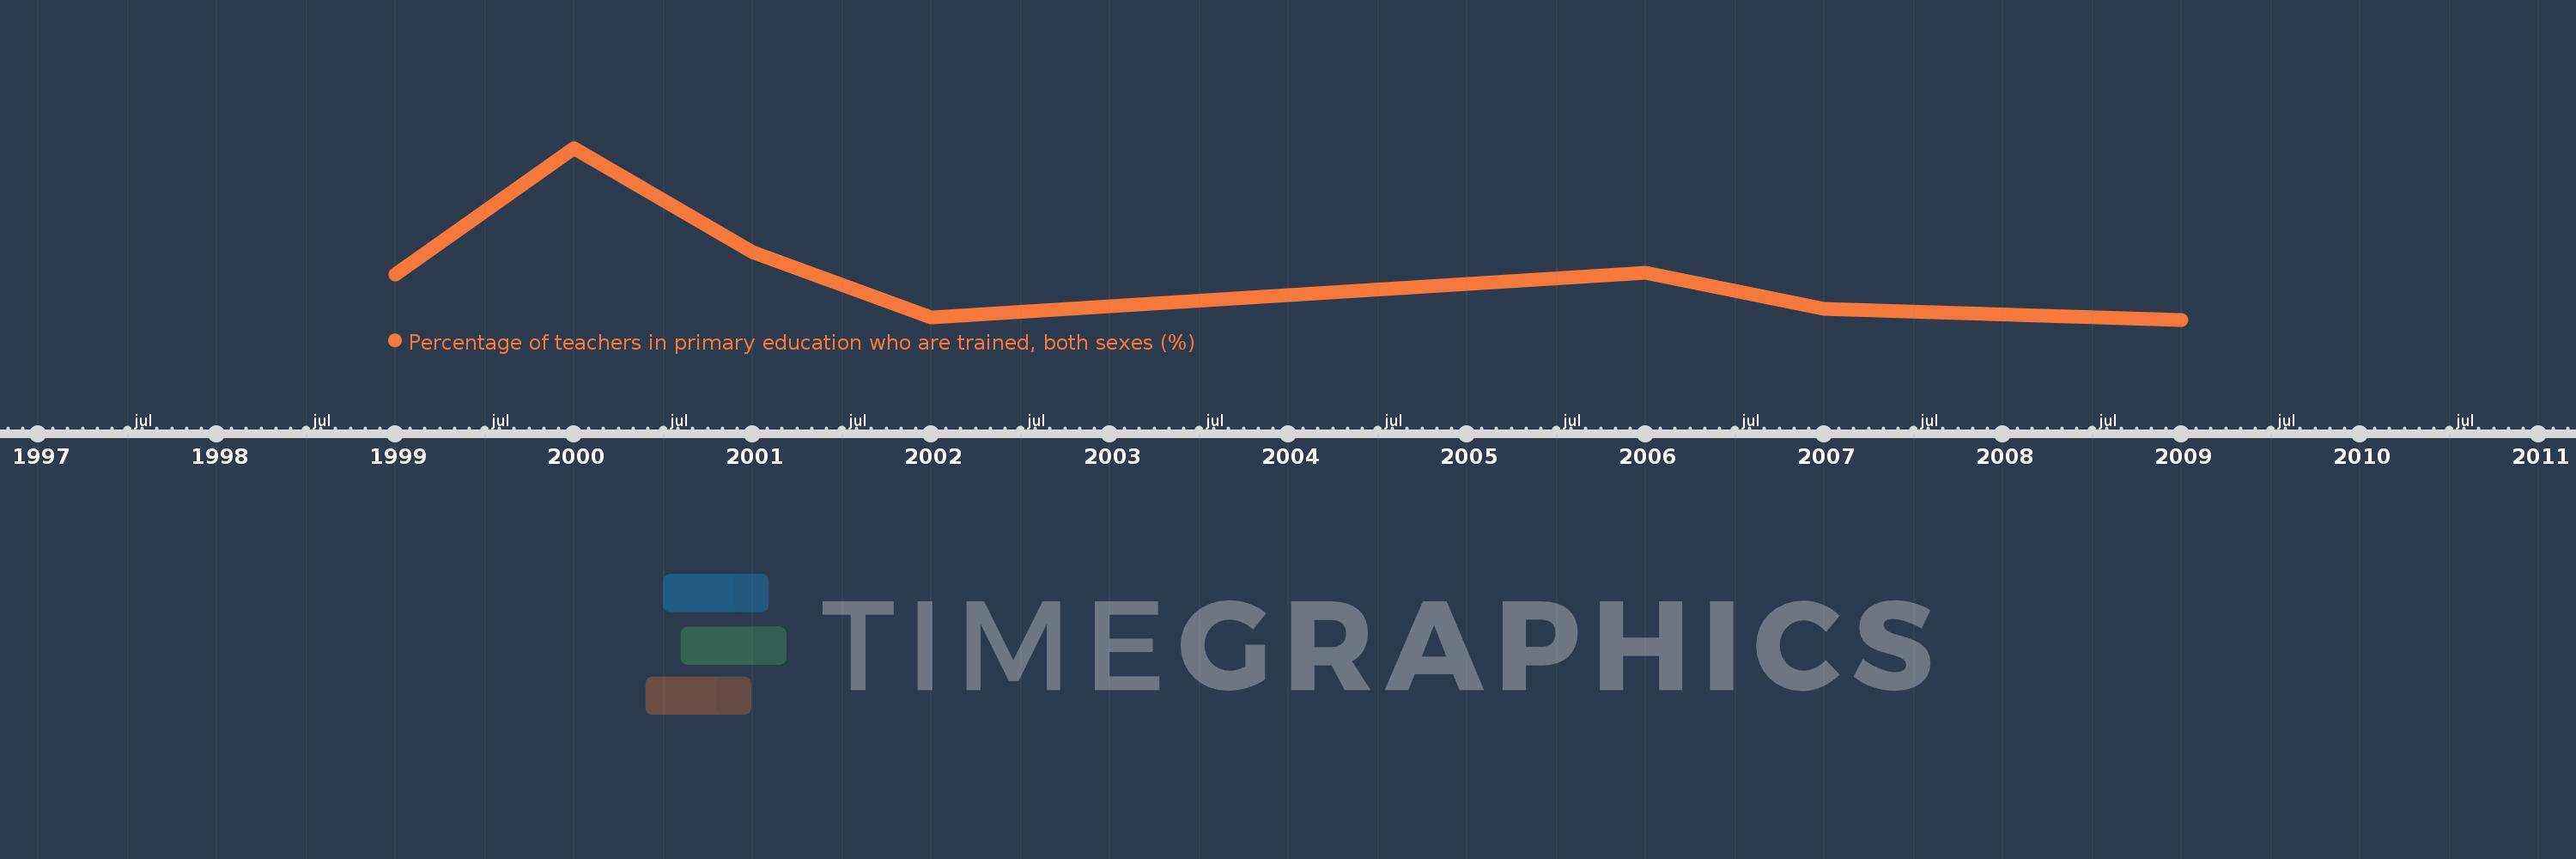
Percentage of teachers in primary education who are trained, both sexes (%)
2009,2007,2006,2002,2001,2000,1999
This statistics in other country:
Timeline:
This timeline shows a graph from 1999 to 2009 of Bhutan. No data until 1998. Number of actual observations by date: 7.
Source name:
World Development Indicators
Source organization:
United Nations Educational, Scientific, and Cultural Organization (UNESCO) Institute for Statistics.
Categories, topics:
Education
Last updated:
apr 23, 2017
Indicators value changes by year
Minimum:
91.467
jan 1, 2009
At the date of observation
Value
Absolute change
Change from previous value
jan 1, 1999
93.706
+93.706
0.0%
jan 1, 2000
100.0
+6.294
6.72%
jan 1, 2001
94.826
-5.174
-5.17%
jan 1, 2002
91.585
-3.241
-3.42%
jan 1, 2006
93.818
+2.234
2.44%
jan 1, 2007
92.007
-1.811
-1.93%
jan 1, 2009
91.467
-0.54
-0.59%
Ranking of countries by current statistics by years


Comments: