29
/
en
AIzaSyAYiBZKx7MnpbEhh9jyipgxe19OcubqV5w
April 1, 2024
236242
Senegal
SEN
true
2
1
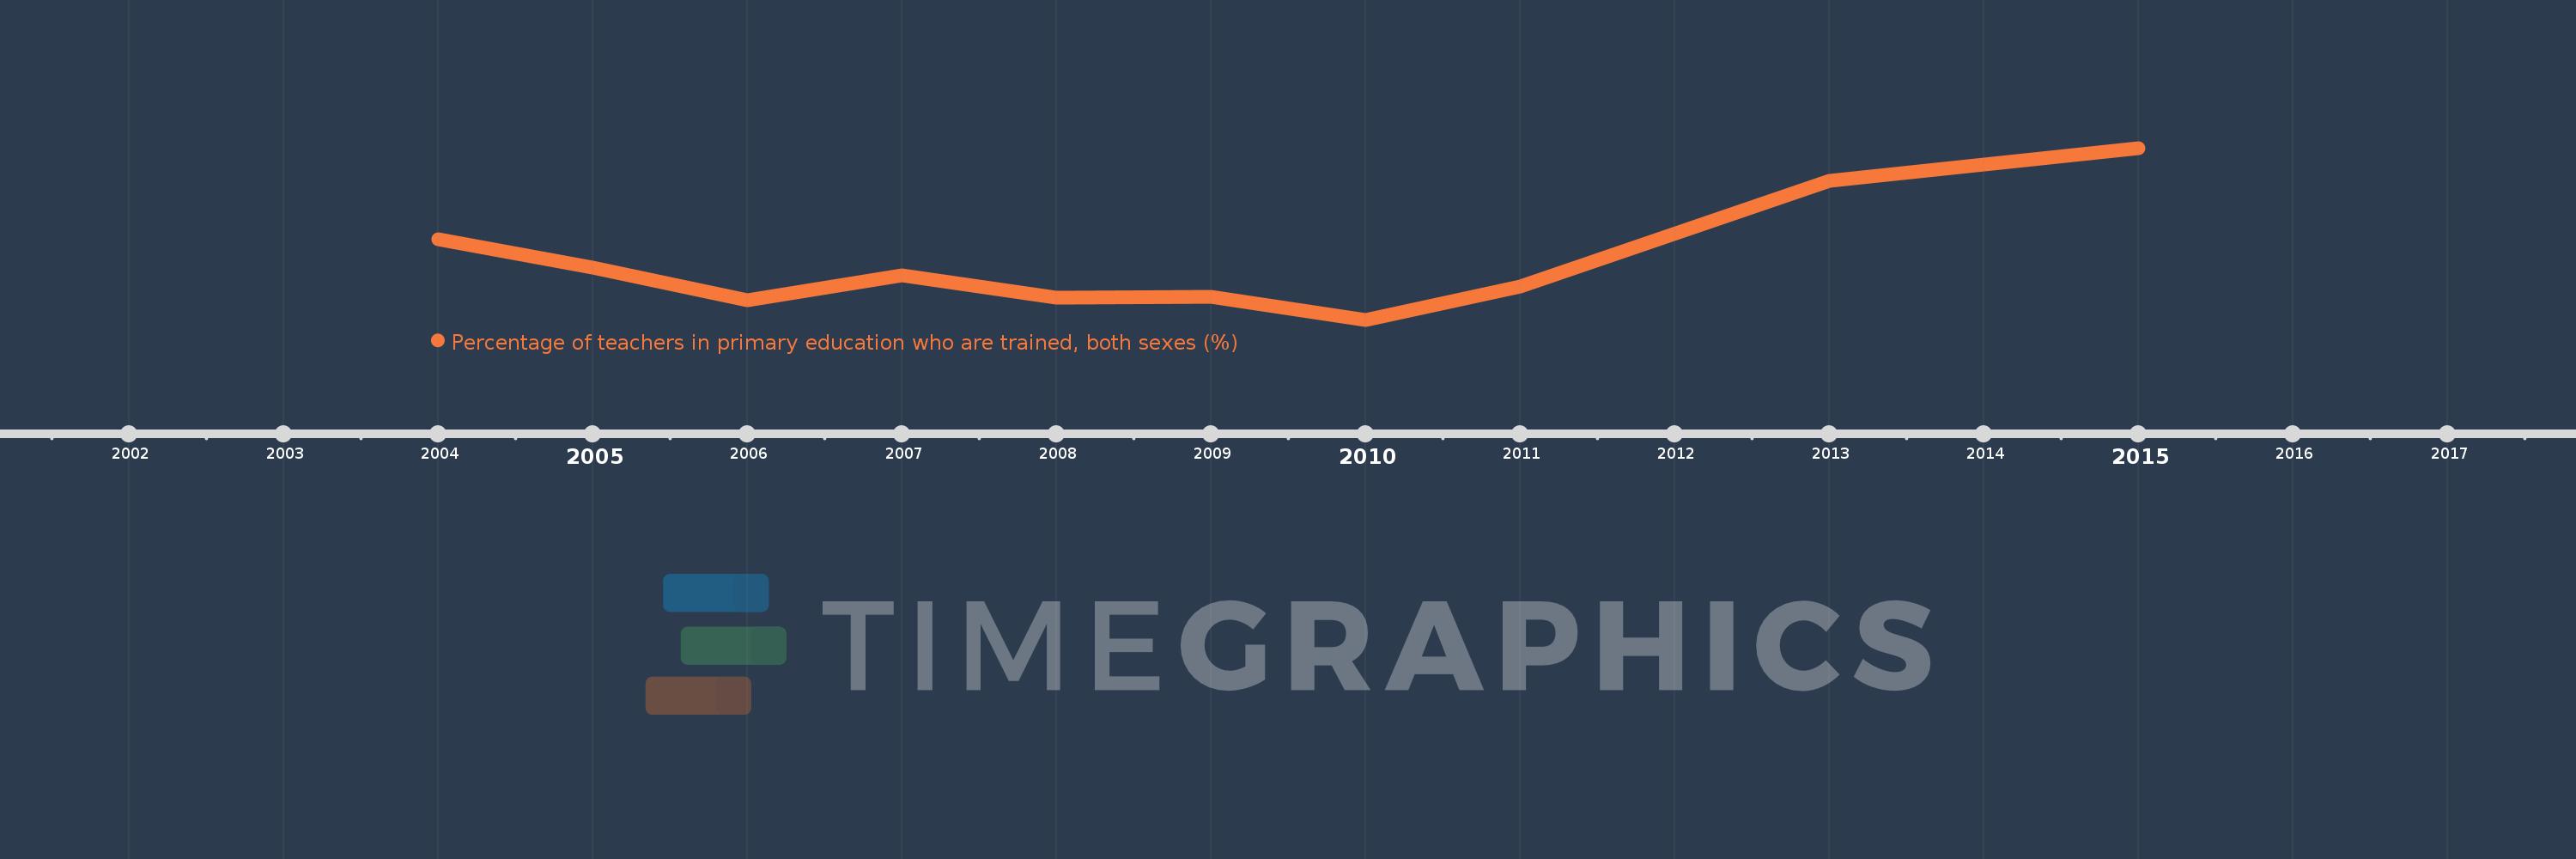
Percentage of teachers in primary education who are trained, both sexes (%)
2015,2013,2011,2010,2009,2008,2007,2006,2005,2004
This statistics in other country:
Timeline:
This timeline shows a graph from 2004 to 2015 of Senegal. No data until 2003. Number of actual observations by date: 10.
Source name:
World Development Indicators
Source organization:
United Nations Educational, Scientific, and Cultural Organization (UNESCO) Institute for Statistics.
Categories, topics:
Education
Last updated:
apr 23, 2017
Indicators value changes by year
Minimum:
42.561
jan 1, 2010
Maximum:
69.968
jan 1, 2015
At the date of observation
Value
Absolute change
Change from previous value
jan 1, 2004
55.379
+55.379
0.0%
jan 1, 2005
50.842
-4.537
-8.19%
jan 1, 2006
45.698
-5.144
-10.12%
jan 1, 2007
49.695
+3.998
8.75%
jan 1, 2008
46.039
-3.657
-7.36%
jan 1, 2009
46.184
+0.145
0.32%
jan 1, 2010
42.561
-3.623
-7.85%
jan 1, 2011
47.853
+5.292
12.43%
jan 1, 2013
64.722
+16.869
35.25%
jan 1, 2015
69.968
+5.246
8.11%
Ranking of countries by current statistics by years


Comments: