29
/
en
AIzaSyAYiBZKx7MnpbEhh9jyipgxe19OcubqV5w
April 1, 2024
123962
Ecuador
ECU
true
2
1
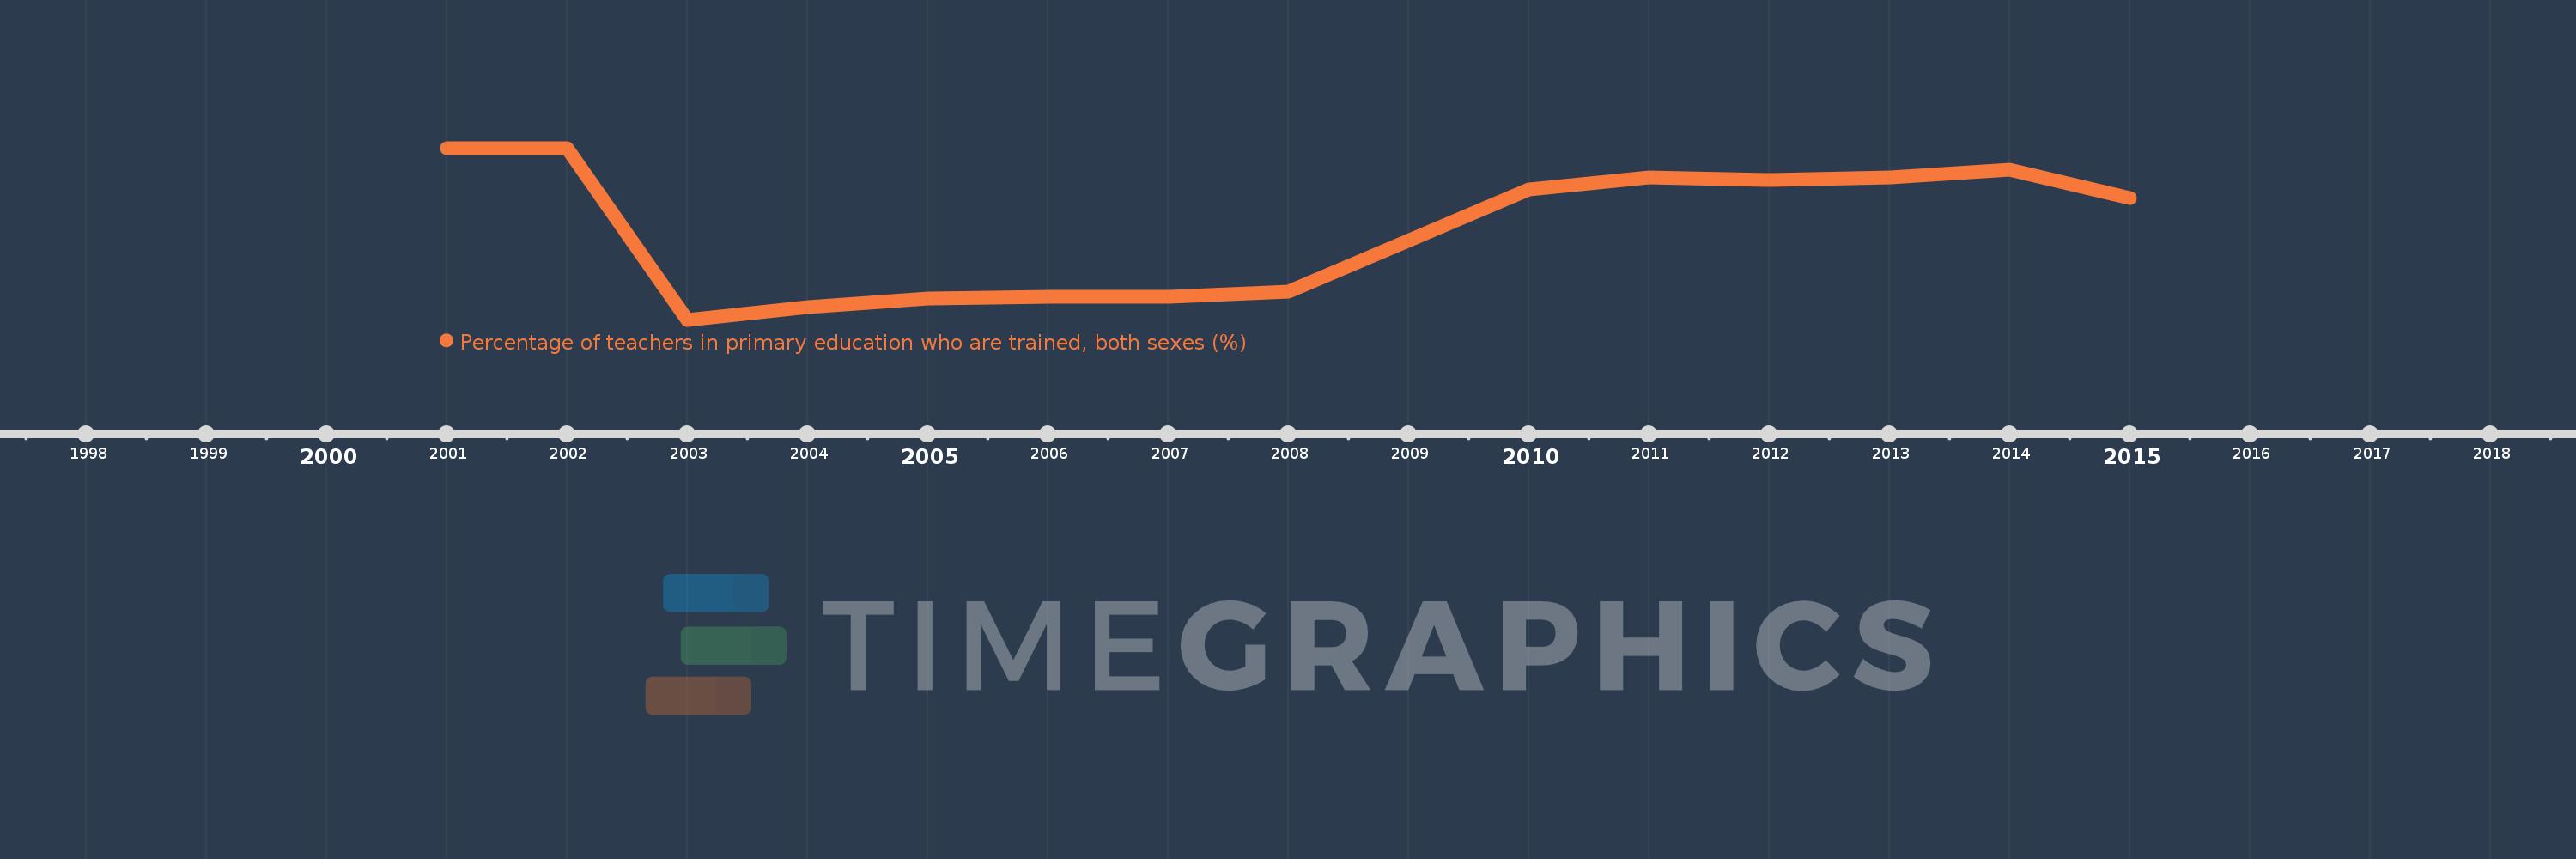
Percentage of teachers in primary education who are trained, both sexes (%)
2015,2014,2013,2012,2011,2010,2008,2007,2006,2005,2004,2003,2002,2001
This statistics in other country:
Timeline:
This timeline shows a graph from 2001 to 2015 of Ecuador. No data until 2000. Number of actual observations by date: 14.
Source name:
World Development Indicators
Source organization:
United Nations Educational, Scientific, and Cultural Organization (UNESCO) Institute for Statistics.
Categories, topics:
Education
Last updated:
apr 23, 2017
Indicators value changes by year
Minimum:
68.598
jan 1, 2003
Maximum:
86.974
jan 1, 2001
At the date of observation
Value
Absolute change
Change from previous value
jan 1, 2001
86.974
+86.974
0.0%
jan 1, 2002
86.927
-0.046
-0.05%
jan 1, 2003
68.598
-18.329
-21.09%
jan 1, 2004
69.91
+1.312
1.91%
jan 1, 2005
70.891
+0.981
1.4%
jan 1, 2006
71.053
+0.162
0.23%
jan 1, 2007
71.057
+0.003
0.0%
jan 1, 2008
71.645
+0.589
0.83%
jan 1, 2010
82.574
+10.929
15.25%
jan 1, 2011
83.794
+1.22
1.48%
jan 1, 2012
83.572
-0.222
-0.26%
jan 1, 2013
83.831
+0.259
0.31%
jan 1, 2014
84.681
+0.849
1.01%
jan 1, 2015
81.633
-3.048
-3.6%
Ranking of countries by current statistics by years


Comments: